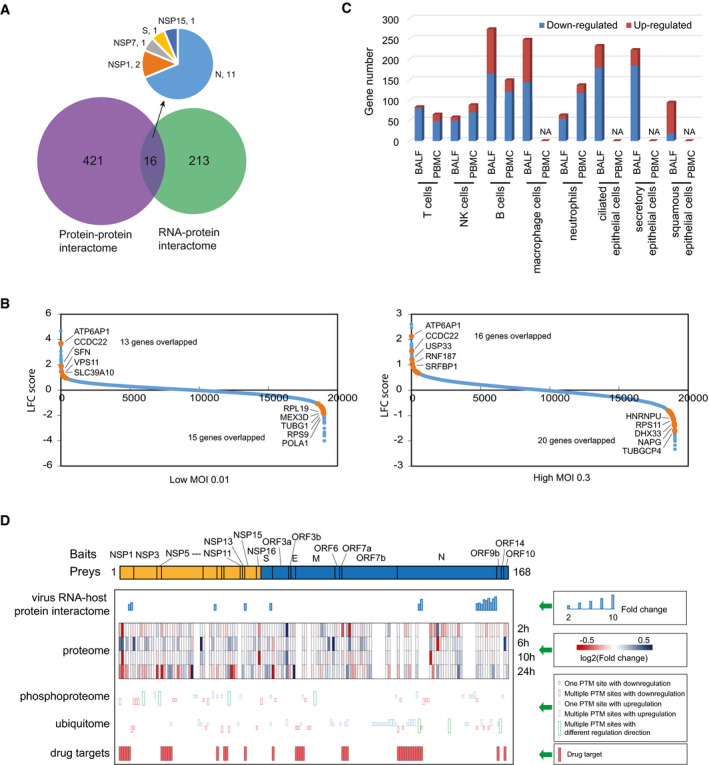
Figure 4. Comparison of SARS‐CoV‐2 virus–host interaction network to other cellular responses to SARS‐CoV‐2 infection.

-
AOverlapping between SARS‐CoV‐2 virus–host interaction with virus RNA–host protein interaction results.
-
BComparison of SARS‐CoV‐2 virus–host interaction to the genetic screening with CRISPR technique. Two different MOIs (MOI 0.01 and MOI 0.3) were used in these screens, and we compared our results with both of these datasets. Blue dots are the identified genes from the genetic screening. Orange dots are the highlighted overlapped genes between our virus–host interaction study and the results from the genetic screening. Top five overlapped genes are indicated.
-
CAnalyzing the number of HCIPs with RNA expression changes identified by single‐cell RNA sequencing using cells from COVID‐19 patients.
-
DIntegrated analysis of RNA–host protein interaction, proteome or protein profiling, phosphoproteomics, and ubiquitome with our HCIPs. HCIPs overlapped with any of the other omics study were listed, which include a total of 168 proteins. The potential drug targets were also included and presented here.
