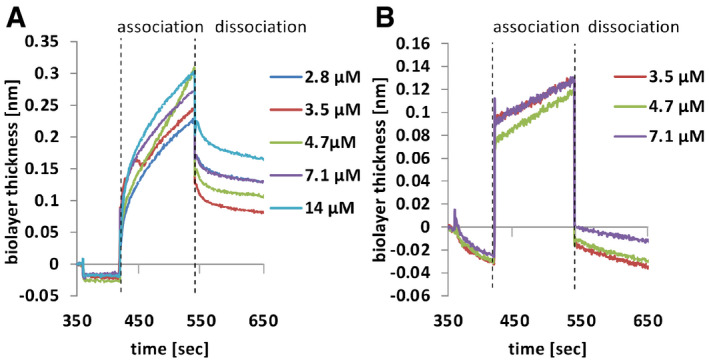
Figure 6. Analysis of the interaction of HO and the phytochrome photosensory domain in vitro .

-
A, BBiolayer interferometry analysis with Apo‐PGP A and holo‐PGP B. Proteins were immobilized at a streptavidin sensor tip. Free binding sites were blocked with biotin. Association and dissociated kinetics were recorded at the indicated HoxA concentrations. K d values were calculated with the manufacturer’s software using a global fit for both experiments.
