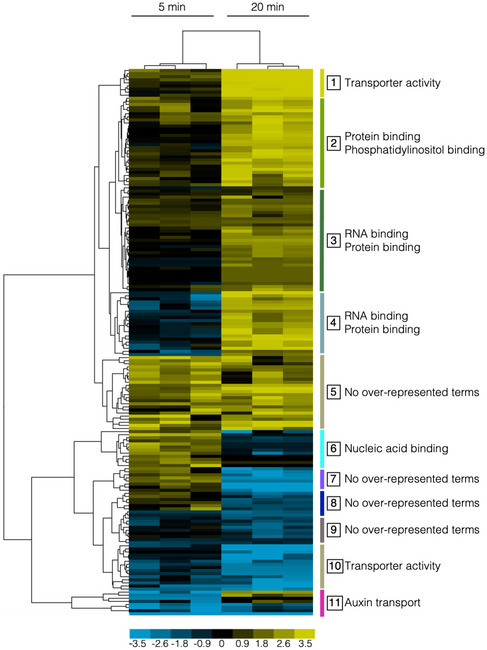
Figure 2. Functional analysis of the phosphoproteome profile reveals signaling and regulatory processes occurring in early and late response to nitrate.

The Figure shows a hierarchical clustering of nitrate phosphoproteins with differential abundance at 5 or 20 min in response to nitrate. Phosphoproteins were clustered using the Euclidean distance method with average linkage. The resulting clusters are shown as a heat map, where vertical bars and numbers to the right of the map denote the group (composed of all terminal nodes in the hierarchical tree) of phosphoprotein (correlation > 0.9) with a selected profile in early (5‐min) or late (20‐min) nitrate response (log 2 fold‐change for each phosphoproteins upon nitrate treatment are referred to KCl‐treated samples). Functional Gene Ontology (GO) categories significantly enriched (hypergeometric test with FDR, P < 0.05) in each cluster are highlighted to the right of the group.
Source data are available online for this figure.
