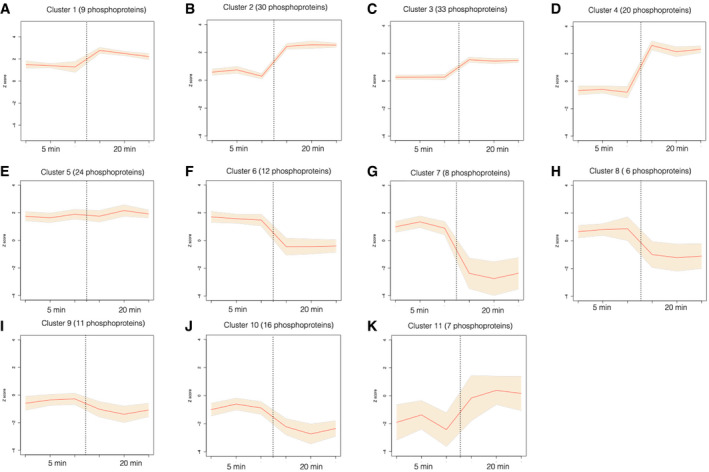
Figure EV2. Hierarchical clustering of nitrate phosphoproteins with differential abundance at 5 or 20 min in response to nitrate treatments.

-
A–KNitrate phosphoprotein abundance patterns for eleven clusters in response to nitrate at 5 or 20 min (correlation distance threshold < 0.9) as described in Figure 2. Graphs show mean values of Z‐scored normalized phosphoproteins levels (orange line) and 95% confidence interval for mean values of each Cluster for the independent experiments (shadow).
