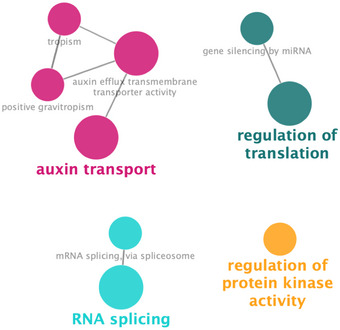
Figure EV3. Over‐represented biological processes in the phosphoproteins gene network in response to nitrate (hypergeometric test with FDR, P < 0.05).

The network was analyzed using BINGO and ClueGO tools in Cytoscape software. Over‐represented gene ontology terms are shown as a node connected by edges based on semantic relationships as defined in the ontology.
Source data are available online for this figure.
