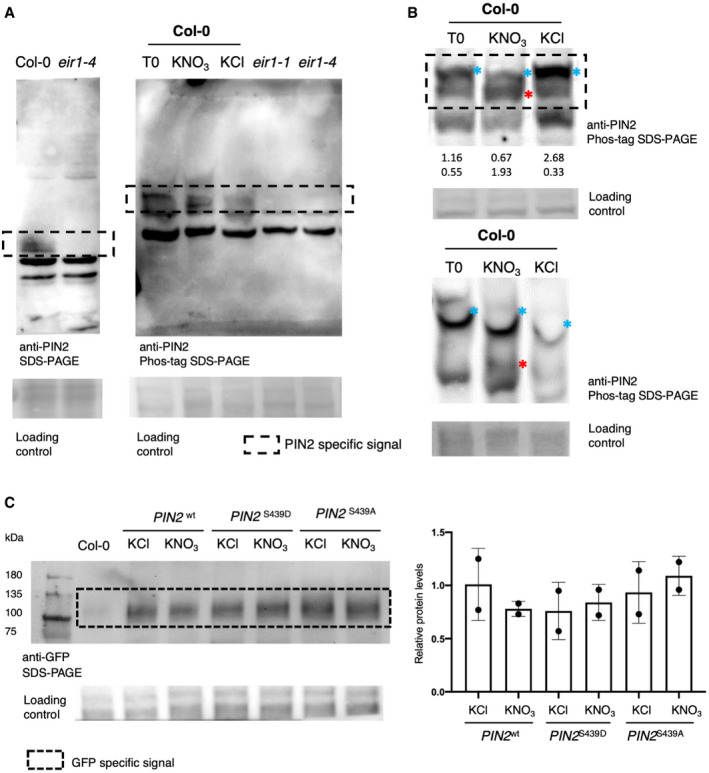
Figure EV4. PIN2 protein analysis in response to nitrate.

- PIN2 detection by Phos‐tag Western blotting (source data Fig 5C). Arabidopsis plants (Col‐0) were grown in ammonium as only nitrogen source and treated with 5 mM KNO3 or 5mM KCl as control. Total protein from roots was analyzed in SDS–PAGE using Phos‐tag to detect changes in phosphorylation status. Immunoblotting was performed with PIN2 antibody. Total proteins isolated from eir1.1 roots were used as a negative control. PIN2‐specific signal was tested as control in Col‐0 and eir1‐4 mutant by normal Western blot SDS–PAGE.
- Phos‐tag Western blotting analysis to detect PIN2 phosphorylation (two independent biological replicates). Arabidopsis plants (Col‐0) were grown in ammonium as only nitrogen source and treated with 5 mM KNO3 or 5 mM KCl, as a control condition. Total proteins from roots were analyzed in SDS–PAGE using Phos‐tag to detect changes in phosphorylation status. Immunoblotting was performed with PIN2 antibody. Blue and red asterisks indicate a slow‐ or fast‐mobility band corresponding to a more or less phosphorylated PIN2, respectively. The numbers below the blot correspond to relative quantification by densitometry using Image J of these two bands, normalized by loading control.
- PIN2‐GFP detection by SDS–PAGE Western blotting. Quantification of two independent replicate Western blot experiments against PIN2‐GFP protein comparing nitrate‐treated (KNO3) and control (KCl) condition at 5 min in Arabidopsis roots for all genotypes eir1‐1 mutant background was complemented with PIN2::PIN2wt‐GFP (PIN2wt), PIN2::PIN2S439D‐GFP (PIN2S439D phospho‐mimic point mutation), or PIN2::PIN2S439A‐GFP (PIN2S439A, phospho‐null point mutation). Total proteins isolated from Col‐0 roots were used as a negative control. Bars represent the mean plus standard deviation of 2 biological replicates.
