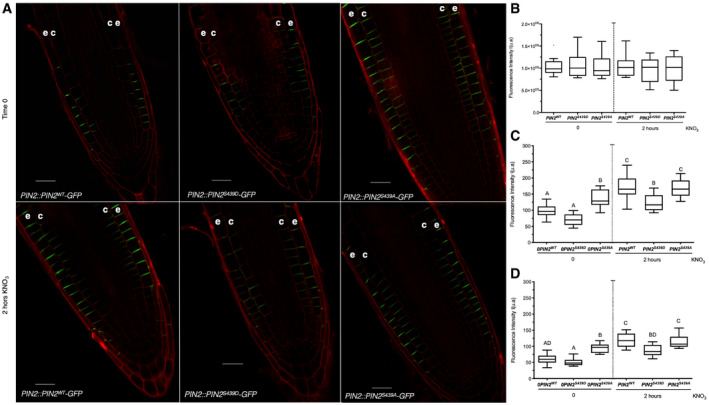
Figure 8. PIN2 phosphorylation at S439 is important for modulation of protein localization in response to nitrate treatments.

-
AConfocal microscopy using Zeiss Airyscan microscope and Zeiss‐blue3.1 software was used to visualize PIN2 in Arabidopsis roots. “e” denotes epidermis and “c” cortex. Scale bar = 20 µm.
-
B–DTuckey box plots show PIN2‐GFP fluorescence intensity quantification (number of roots analyzed per experimental conditions = 8–10; arbitrary units, a.u.) at the total cell membrane in roots (B), and from epidermal (C) and cortex (D) plasma membrane in the different genotypes. The box plot shows the data within the interquartile range (25th and 75th percentiles) and a solid black line represents the median. Whiskers show maximum and minimum values no further than 1.5× IQR (interquartile range). Outlier data are plotted individually. Letters denote statistically significant difference between means as determined by one‐way ANOVA followed by Tukey HSD post hoc test (P < 0.05).
Source data are available online for this figure.
