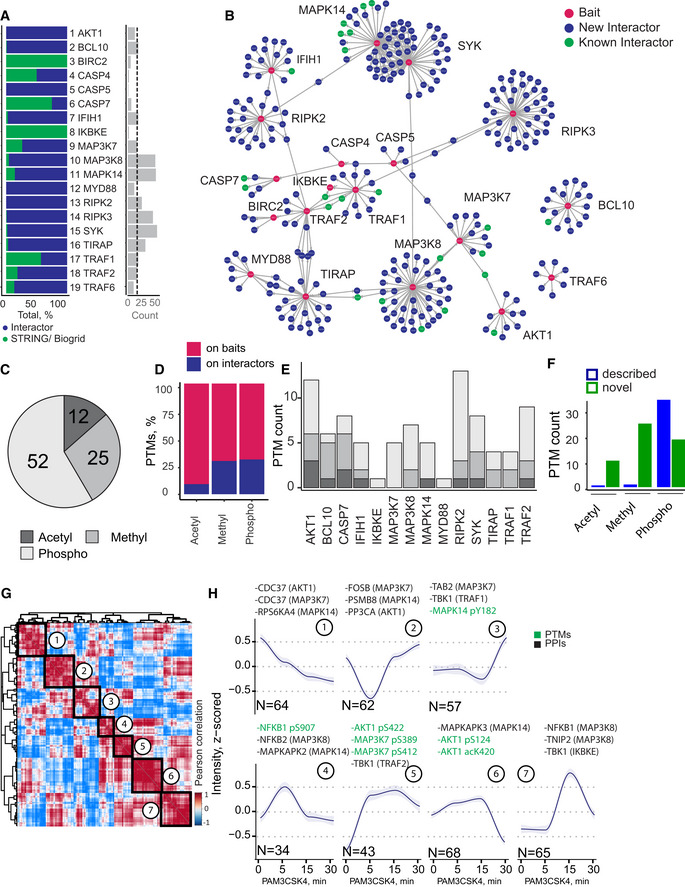
Figure 2. Dissection of protein signaling networks in human monocytes using MIP‐APMS.

- Percentage of previously described interactors (green) and novel interactors (blue), and the count of significant interactors (FDR < 0.01, enrichment > 2) per bait protein (median interactor count: 16).
- Protein–protein interaction network of clustered interaction data. Edges indicate interactions, with shared interactions connecting the individual MIP‐APMS experiments. Red nodes correspond to bait proteins, green nodes to interactors reported in the literature, and blue nodes to novel interactors.
- Numbers of acetylations, methylations, and phosphorylations identified on bait proteins and interactors.
- Percentage of PTMs identified on bait proteins and interactors.
- Numbers of PTMs on bait proteins/interactors of individual pull‐downs.
- Numbers of novel and described (Uniprot‐annotated) acetylations, methylations, and phosphorylations.
- Unsupervised clustering (Pearson correlation) of the z‐scored intensity profiles of all PPIs (357) and PTMs (37) upon TLR2 activation, partitioned in seven clusters.
- Dynamic profiles of co‐regulated PTMs and PPIs with close network proximity, from the indicated clusters; median z‐scored intensity of each time point (blue: median, gray: confidence interval = 0.95, method: loess); n, number of proteins in clusters 1–7. Selected proteins from each cluster are indicated, with the bait proteins in parentheses.
Data information: See also Fig EV3, Table EV2 for PPIs, and Table EV3 for PTMs.
