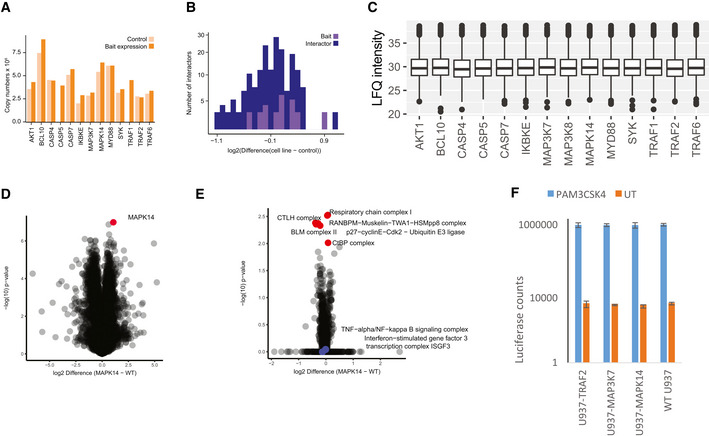
Evaluation of the effect of bait overexpression on the proteomes of 13 bait cell lines (5,752 total protein IDs). Comparison of the copy numbers of overexpressed bait proteins in the non‐overexpressing cells (U937 WT) and bait‐overexpressing U937 cells. Copy numbers of bait proteins were calculated with the Perseus Plugin based on the LFQ intensity of the respective bait protein. LFQ intensities of endogenous protein and the overexpressed bait proteins are summarized.
Evaluation of the effect of bait overexpression on interactor expression, plotted as prey expression difference between the control and bait‐transduced cells.
Total protein LFQ intensity in full proteomes across different cell lines. Central band of the boxplot shows the median, boxes represent the IQR, and 3 biological replicates were performed for every condition.
Protein expression difference of wildtype U937 versus transduced U937 (MAPK14‐U937; measured in triplicates, bait protein shown in red).
1D Annotation enrichment comparing U937 WT versus transduced U937 (MAPK14‐U937) with significantly changing Corum annotations highlighted in red and infection‐associated pathways highlighted in blue.
Luciferase assay of wild‐type U937 and transduced U937 cell lines (MAPK14‐U937, MAP3K7‐U937, TRAF2‐U937) comparing raw intensity counts of non‐activation (orange) versus PAM3CSK4 activation (blue). Bars represent median, error bars represent s.d., and four biological replicates were performed per condition.