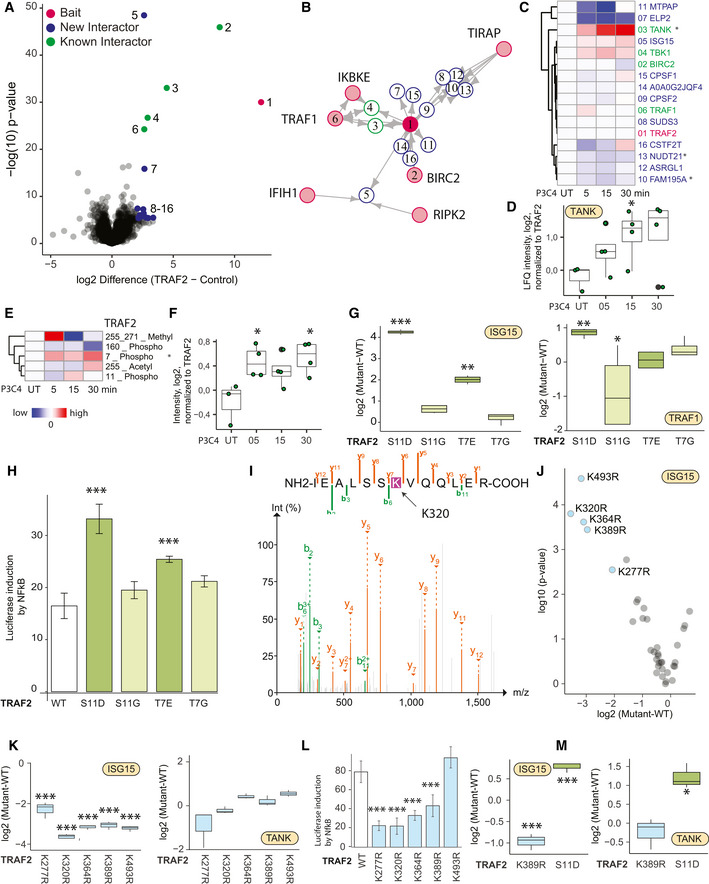
Figure 3. N‐Terminal phosphorylation of TRAF2 and ISG15 is dynamic functional regulators downstream of TLR2.

- Volcano plot representing the interactome of TRAF2 (measured 15× in biological replicates) compared against all other pull‐downs in the control group. The results of the t‐tests are represented in volcano plots, which show the protein enrichment versus the significance of the enrichment. Numbers indicate enrichment ranks with the heatmap labels of (C) serving as the legend. Significant interactors of TRAF2 (two‐tailed t‐test, FDR < 0.01, enrichment > 4) are colored in blue (novel interactors) and green (known interactors).
- Interactors of TRAF2 (blue: novel interactors, green: known interactors) with interconnecting proteins between different baits colored in gray.
- Hierarchical clustering of significant interactors of TRAF2 upon activation with significant hits in at least one time point denoted with an asterisk. Cell activation was performed for 5, 15, and 30 min with the TLR2 ligand PAM3CSK4 (P3C4).
- Intensity profile of the TRAF2 interactor TANK upon activation, normalized to TRAF2 bait LFQ intensity.
- Hierarchical clustering of the TRAF2 PTMs (acetylation, methylation, and phosphorylation) upon activation, with significant hits (t‐test) in at least one time point denoted with an asterisk.
- Intensity profile of the phosphorylation of TRAF2 on Thr7 upon activation, normalized to TRAF2 bait intensity. Central band of the boxplot shows the median, boxes represent the IQR, 3 biological replicates were performed for UT, and 4 biological replicates were performed for additional time points. P‐values were calculated by t‐test. Asterisks indicate significant differences. *P‐value < 0.05.
- Intensity profile of TRAF2 interactors ISG15 and TRAF1 in different TRAF2 phospho‐variants, normalized to TRAF2 wild‐type intensities. Central band of the boxplot shows the median, boxes represent the IQR, and 4 biological replicates were performed for every condition. P‐values were calculated by t‐test. Asterisks indicate significant differences **P‐value < 0.01, ***P‐value < 0.001.
- Induction of NFκB determined based on luciferase luminescence in TLR2‐activated U937 NFκB reporter cells transfected with genes encoding different TRAF2 phospho‐variants. Bar represents the median, error bars represent the standard deviation, and 4 biological replicates were performed for additional time points. P‐values were calculated by t‐test. Asterisks indicate significant differences. ***P‐value < 0.001.
- MS/MS Spectrum containing GlyGly modification K320 on TRAF2 after GlyGly enrichment on TRAF2 MIP‐APMS.
- Differences and P‐values of ISG15 intensity in TRAF2 K‐>R mutants compared against TRAF WT
- Intensity profile of TRAF2 interactors ISG15 and TANK in TRAF2 K‐>R mutants, normalized to TRAF2 wild‐type intensities. Central band of the boxplot shows the median, boxes represent the IQR, and four biological replicates were performed for every condition. P‐values were calculated by t‐test. Asterisks indicate significant differences. ***P‐value < 0.001.
- Induction of NFκB determined based on luciferase luminescence in TLR2‐activated U937 NFκB reporter cells transfected with genes encoding different TRAF2 K→R mutants (each bar represents a mean from three independent measurements; error bars represent the standard deviation; ***P‐value < 0.001).
- Intensity profile of TRAF2 interactors ISG15 and TANK in TRAF2‐K389R and S11D mutants in human primary macrophages. Central band of the boxplot shows the median, boxes represent the IQR, and three biological replicates were performed for every condition. P‐values were calculated by t‐test. Asterisks indicate significant differences **P‐value < 0.01, *P‐value < 0.05, ***P‐value < 0.001.
Data information: Experiments in (A–L) were performed in U937 cell lines. Gray boxes indicate missing values. IQR stands for interquartile range and represents the 25th to 75th percentile. See also Table [Link], [Link], [Link], [Link].
