-
A
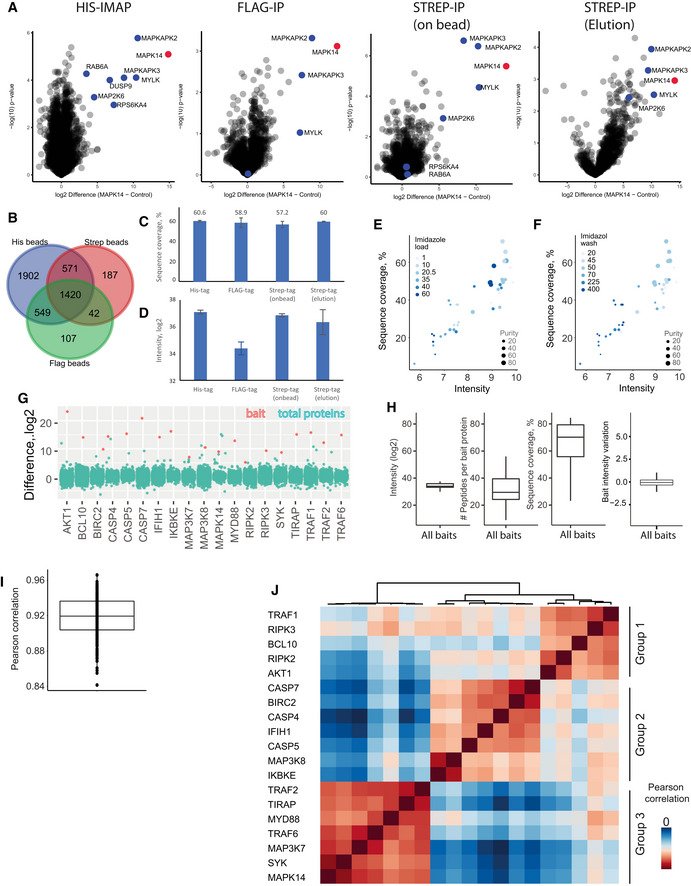
Interactome of MAPK14 with different IP strategies from HEK cells transfected with MAPK14‐HisGSGFlag or MAPK14‐Strep‐tag (measured 3×, bait proteins are shown in red, prey proteins significant in His‐IMAC in blue)
-
B
Comparison of background proteins between His, Flag, and Strep beads. Proteins that were identified and quantified at least once were included in the Venn diagram.
-
C
Sequence coverage of MAPK14 with different IP strategies from HEK cells transfected with MAPK14‐HisGSGFlag or MAPK14‐Strep‐tag. Each bar represents the median of three experiments. Bars represent median, and error bars represent s.d.
-
D
Protein intensity (log2) of MAPK14 after enrichment with different affinity matrices. Each enrichment was performed with equal bead amounts (50 μL each) and 5 Mio cells as input. Each bar represents the median of three experiments. Bars represent median, and error bars represent s.d.
-
E, F
Correlation of sequence coverage and bait protein intensity for different imidazole concentrations in loading buffer (E) and wash buffer (F) is shown. Dot size indicates protein purity (in %).
-
G
Difference (log
2) of baits versus control for all identified proteins in each interactome (see also Table
S1). Bait proteins are depicted in red and all other identified proteins in turquoise.
-
H
Median intensities (log2), peptide numbers, sequence coverage, and bait LFQ variation of bait proteins. For median bait LFQ variation, bait proteins were normalized to one of the replicates and median difference was plotted. Central band of the boxplot shows the median, boxes represent the IQR, and 19 independent replicates (i.e., 19 bait proteins) were used.
-
I
Median Pearson correlation between pull‐downs in different control groups. Central band of the boxplot shows the median, boxes represent the IQR, and 19 independent replicates (i.e., 19 bait proteins) were used.
-
J
Comparison of different pull‐downs reveals high correlation between LFQ intensities within three different background control groups.