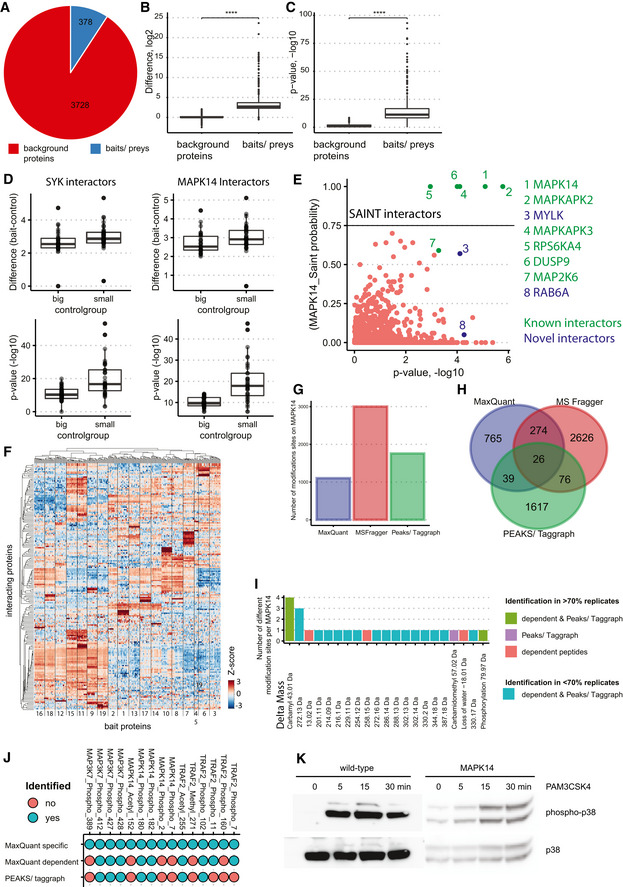
Pie chart showing the proportion of quantified bait/prey proteins (blue) in comparison with background proteins (red)
Boxplots with enrichment differences (log2) of bait/prey versus background proteins. Central band of the boxplot shows the median, boxes represent the IQR, and 19 independent replicates (i.e., 19 bait proteins) were used. P‐values were calculated by t‐test. Asterisks indicate significant differences ****P‐value < 0.0001, *P‐value < 0.05, ***P‐value < 0.001.
Boxplots with P‐values (−log10) of bait/prey proteins versus background proteins. Central band of the boxplot shows the median, boxes represent the IQR, and 19 independent replicates (i.e., 19 bait proteins) were used. P‐values were calculated by t‐test. Asterisks indicate significant differences ****P‐value < 0.0001, *P‐value < 0.05, ***P‐value < 0.001.
Impact of interconnected interactors on enrichment differences and P‐values: Interactor calling was performed for indicated proteins using big (with SYK and MAPK14) and small (without SYK and MAPK14) control groups. Differences of all significant interactors and P‐values are shown individually for SYK and MAPK14 pull‐downs. Central band of the boxplot shows the median, boxes represent the IQR, and 16 biological replicates were used.
Saint probability (probability of the interactor being a true interactor) plotted against the P‐value from the Student's t‐test comparing MAPK14 versus control (transduced with His‐Tag only). Significant interactors from t‐test analysis are colored in turquoise; SAINT interactors (75% probability of interactor being a true interactor) are above the horizontal line of 0.75. Known interactors are colored green.
Heatmap with
z‐scored LFQ intensities of significantly interacting proteins for each bait protein (two‐tailed
t‐test, FDR < 0.01, enrichment > 4) clustered by Euclidean distance. Baits are numbered as in Fig
2A.
Number of modifications on MAPK14 detected with the indicated open search algorithms in at least one replicate. Open search was performed in MaxQuant (dependent peptide mode), MS Fragger, and Peaks/Taggraph on the drug mode of action dataset of MAPK14 (Fig
5). Mass offsets detected at distinct amino acid positions were kept separately.
Venn diagram showing the overlap of modifications identified with open search algorithms in at least one replicate.
Number of distinct modifications on MAPK14, identified in at least 70% of the replicates with MaxQuant (red), Peaks/Taggraph (violet), MaxQuant & Peaks/Taggraph (green) and with less than 70% valid values (turquoise) in all searches.
Comparison of MaxQuant specific searches for MAP3K7, MAPK14, and TRAF2 to dependent peptide analysis (MaxQuant) and PEAKS/Taggraph. Identified and quantified sites are depicted in turquoise, not identified sites in red.
Activation of wild‐type and transgenic MAPK14‐U937 cells with PAM3CSK4. Western blotting analysis using antibodies raised against phospho‐MAPK14 and total MAPK14.

