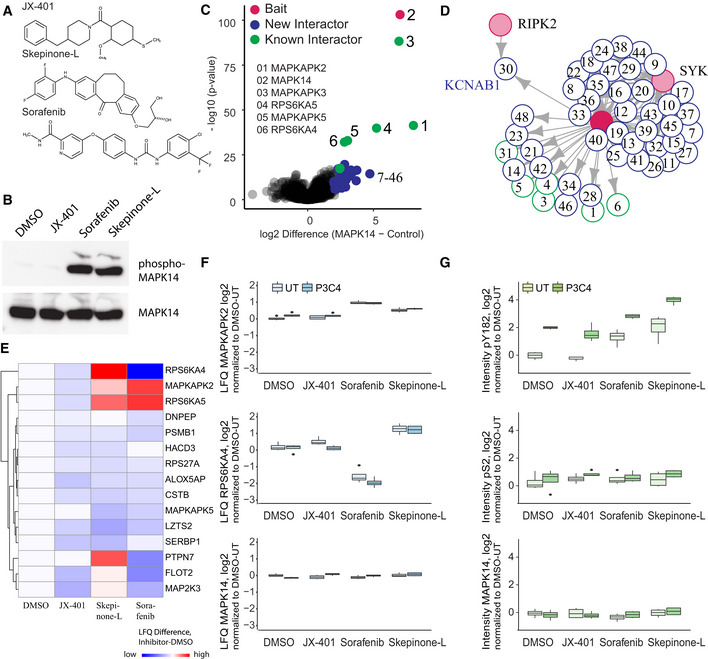
Figure 5. Dissecting drug mode of action for MAPK14 inhibitors with MIP‐APMS.

- Chemical structures of MAPK14 inhibitors JX‐401, skepinone‐L, and sorafenib.
- Phosphorylation of MAPK14 in U937 WT after treatment with the inhibitors, analyzed by Western blotting using an alpha‐phospho‐MAPK14 antibody. Total MAPK14, detected by alpha‐MAPK14 antibody, was used a loading control.
- The interactome of MAPK14 compared against all other pull‐downs in the control group. The results of the t‐tests are represented in volcano plots, which show the protein enrichment versus the significance of the enrichment. Numbers indicate enrichment ranks with the heatmap labels of (C) serving as the legend. Only the top interactors of MAPK14 are numbered. The complete list can be found in Table EV1.
- Interactors of MAPK14 (blue: novel interactors, green: known interactors) with interconnecting proteins between different baits colored in gray.
- Heatmap of MAPK14 interactors significantly altered upon treatment with the different MAPK14 inhibitors, with significant hits in at least one treatment (t‐test, P‐value < 0.05) denoted with an asterisk. Treatments were normalized to DMSO control. The complete list can be found in Table EV5.
- LFQ intensity profiles of the MAPK14 interactors RPS6KA4 and MAPKAPK2 and MAPK14 after treatment with different MAPK14 inhibitors, normalized to MAPK14 bait intensity. Drug mode of action was analyzed in the presence (P3C4, 0.5 μg/ml, 30 min) or absence of P3C4 after inhibitor treatment. Central band of the boxplot shows the median, boxes represent the IQR, and 4 biological replicates were performed for every condition.
- Intensity profiles of MAPK14 phosphorylation on positions Ser2 and Tyr182 and MAPK14 protein intensity after treatment with different MAPK14 inhibitors, normalized to MAPK14 bait intensity. Drug mode of action was analyzed in the presence (P3C4, 0.5 μg/ml, 30 min) or absence of P3C4 after inhibitor treatment. Central band of the boxplot shows the median, boxes represent the IQR, and 4 biological replicates were performed for every condition.
Data information: Gray boxes indicate missing values. Bars represent median, error bars s.d. See also Fig EV5, Table EV5.
