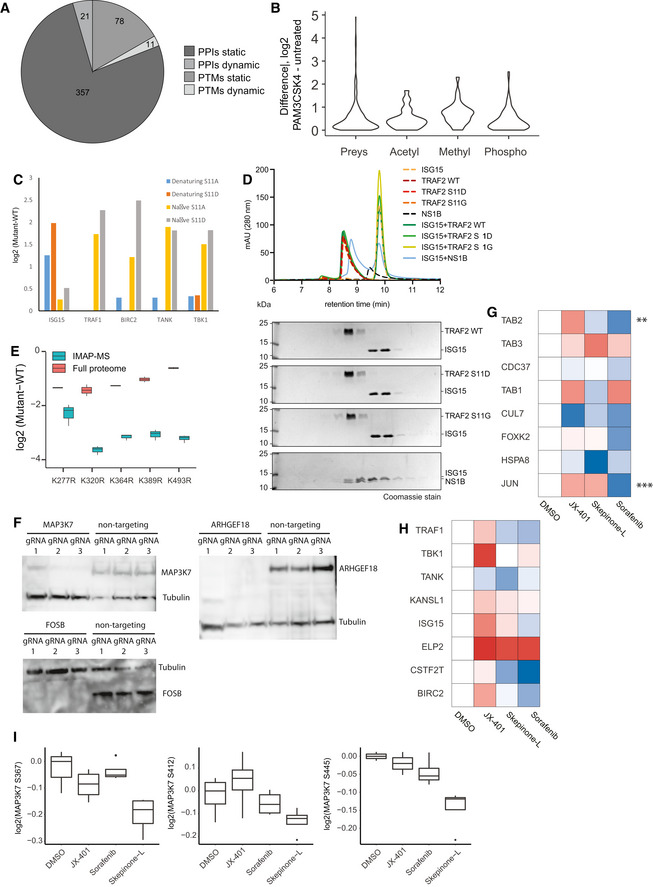
Overview of the dynamic and static PPIs and PTMs identified in 17 different cell lines.
Global PPI and PTM differences upon PAM3CSK4 activation between prey proteins, and acetylated, methylated, and phosphorylated peptides.
Comparison of TRAF2 interactors in native (0.05% NP‐40 in lysis buffer) versus denaturing (6 M GdmCl in lysis buffer). Intensity profile of TRAF2 interactors in different TRAF2 phospho‐variants, normalized to TRAF2 wild‐type intensities.
Differential expression of ISG15 in K‐>R TRAF2 mutants versus wild‐type TRAF2 in full proteomes and interactomes. Central band of the boxplot shows the median, boxes represent the IQR, and 2 biological replicates were performed per condition.
Analytical size‐exclusion chromatography profile of TRAF2‐ISG15 binding studies. For each analysis, the individual profiles are shown and indicated by color. Coomassie‐stained SDS–PAGE lanes correlate with the approximate retention times in the chromatogram.
Western blot analysis of CRISPR‐KO reporter cell lines with antibodies raised against MAP3K7, ARHGEF18, FOSB. Tubulin was used as a loading control.
Heatmap of MAP3K7 interactors after treatment with different MAPK14 inhibitors, with significant hits in at least one treatment (t‐test, P–value < 0.05) denoted with an asterisk. Treatments were normalized to DMSO control.
Heatmap of TRAF2 interactors after treatment with different MAPK14 inhibitors. Treatments were normalized to DMSO control.
Intensity profile of MAP3K7 phosphorylation on Ser367, Ser412, and Ser445 after treatment with different MAPK14 inhibitors, normalized to MAP3K7 bait intensity. Central band of the boxplot shows the median, boxes represent the IQR, and four biological replicates were used per condition. P‐values were calculated by t‐test. Asterisks indicate significant differences ****P‐value < 0.0001, *P‐value < 0.05, ***P‐value < 0.001.

