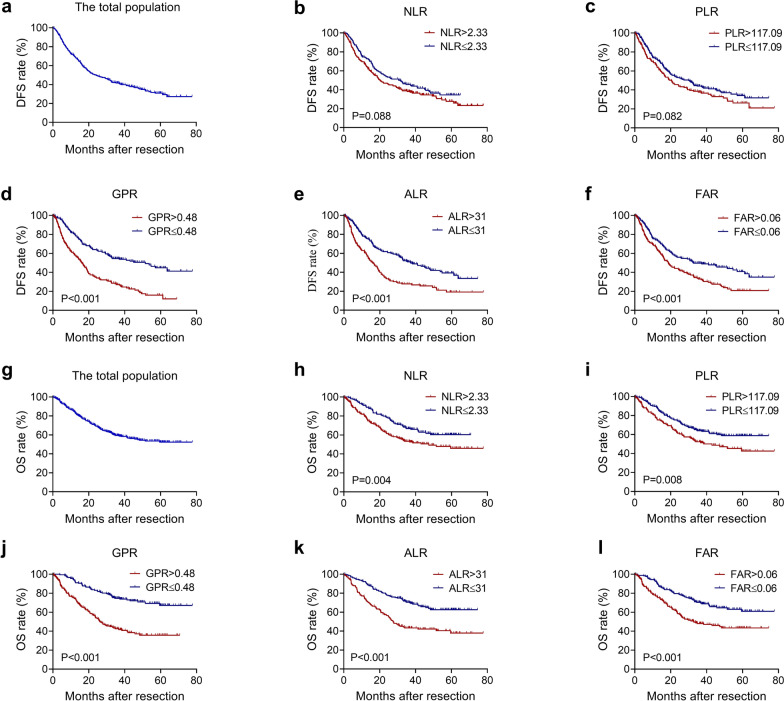
Figure. 3.
Kaplan–Meier analysis of (a) the total population(N = 347), (b) NLR(NNLR>2.33 = 188, NNLR≤2.33 = 159), (c) PLR(NPLR>117.09 = 135, NPLR≤117.09 = 212), (d) GPR(NGPR>0.48 = 165, NGPR≤0.48 = 182), (e) ALR(NALR>31 = 141, NALR≤31 = 206), and (f) FAR(NFAR>0.06 = 171, NFAR≤0.06 = 176) for DFS; Kaplan–Meier analysis of (g) the total population(N = 347), (h) NLR(NNLR>2.33 = 188, NNLR≤2.33 = 159), (i) PLR(NPLR>117.09 = 135, NPLR≤117.09 = 212), (j) GPR(NGPR>0.48 = 165, NGPR≤0.48 = 182), (k) ALR(NALR>31 = 141, NALR≤31 = 206) and (l) FAR(NFAR>0.06 = 171, NFAR≤0.06 = 176) for OS

