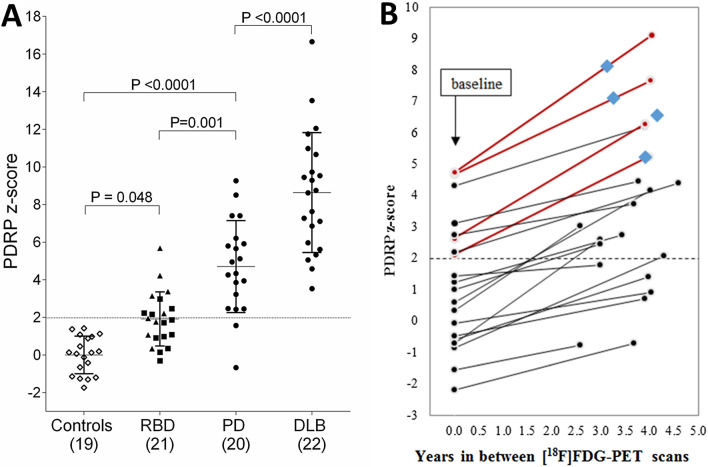
Fig. 2.
A PDRP z-scores across groups. PDRP expression was calculated in all groups and z-transformed to the healthy controls. PDRP expression z-scores were compared across groups with a one-way analysis of variance. Post-hoc comparisons were Bonferroni-corrected. Triangles indicate patients with an abnormal DAT scan, squares indicate patients with a normal DAT scan. From: (Meles et al. 2017). The dashed line indicates z = 1.98, scores above this line are considered supra-threshold (see (Kogan et al. 2020)). B PDRP expression z-score changes between baseline and follow-up 18F-FDG PET imaging in 20 iRBD patients. PDRP expression increased in all subjects. Four subjects (indicated by Burgundy lines), all with baseline significant PDRP z-scores, phenoconverted to clinical PD during the study. Diamonds denote point of clinical phenoconversion. From: (Kogan et al. 2020)

