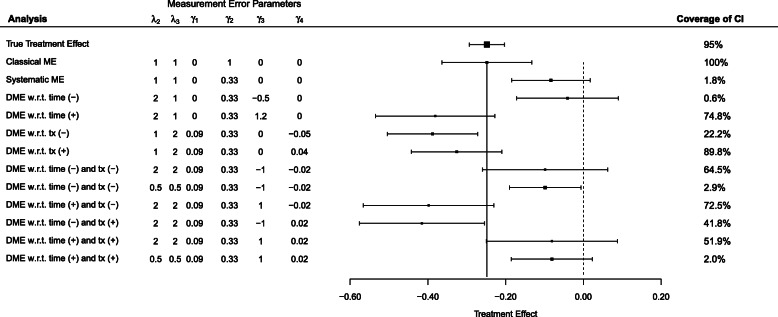
Fig. 3.
Forest plot of treatment effects, their associated 95% confidence intervals, and coverage of those intervals for the true treatment effect (top row), and naive treatment effects for a range of analyses based on altering the measurement error parameters in Table 2. The (+) and (−) refer to whether the γ3 and γ4 parameters are greater than or less than 0, respectively. The vertical solid line shows the true effect. The vertical dotted line at 0 indicates no treatment effect. In all analyses, λ1=1.86 and the sample size is n=372 per group

