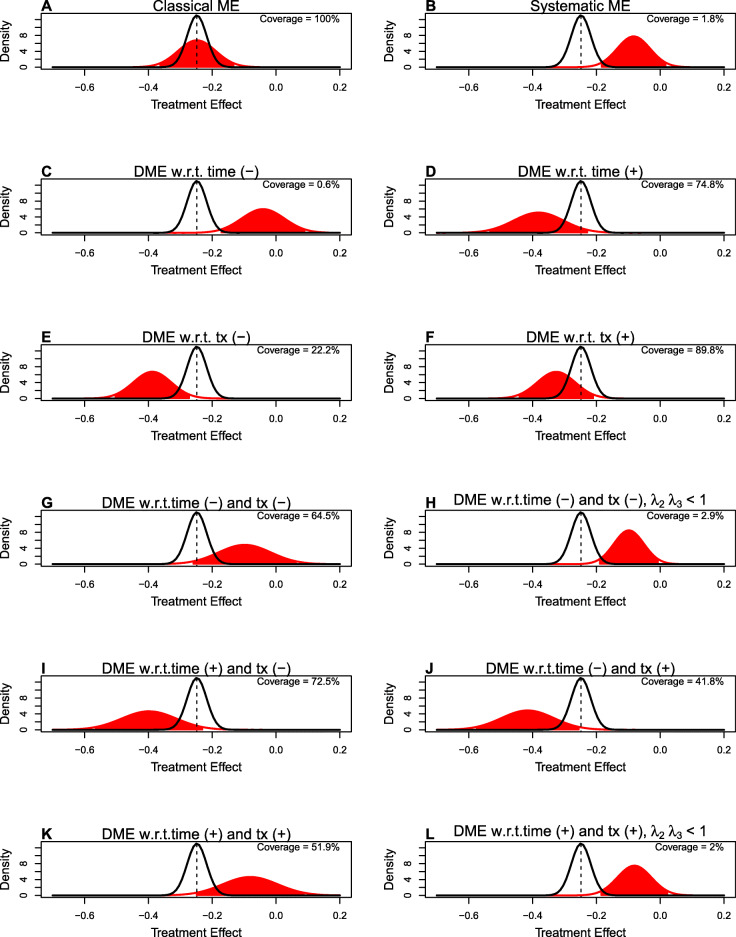
Fig. 4.
Density plots for the distribution of the naive treatment effect under different scenarios of measurement error (in red) compared to the true treatment effect (in black). Each panel A-J represents a different measurement error scenario. The dashed lines indicates the mean true treatment effect. The 95% confidence interval of the naive treatment effect is the shaded area under the curve (in red). Measurement error parameters for each scenario are equal to values found in Fig. 3. Coverage of the true treatment effect is 95%. In all analyses, the sample size is n=372 per group

