Fig. 4.
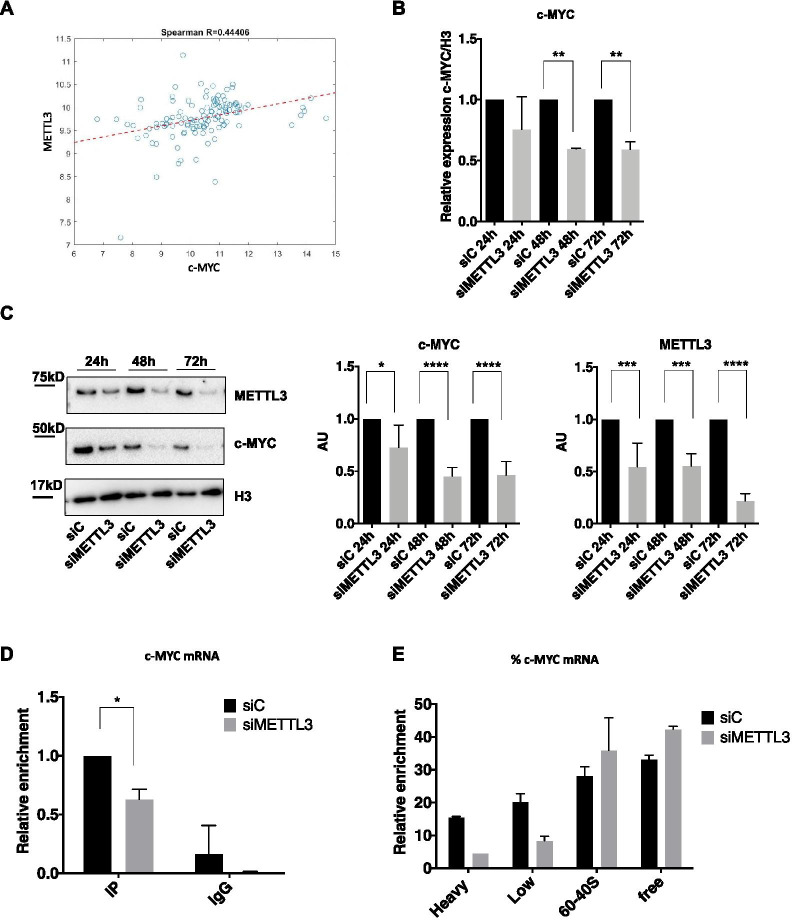
METTL3 controls c-MYC expression. A Spearman’s correlation plot showing the expression of METTL3 and c-MYC mRNAs in Thymoma and Thymic carcinoma samples from the TCGA dataset. B RT-qPCR analysis of c-MYC at 24 h, 48 h, 72 h of METTL3 silencing in TC1889 cells (n = 3). C Representative western blot analysis of c-MYC and METTL3 proteins at 24 h, 48 h and 72 h after silencing of METTL3 in TC1889 cells (left). Quantifications of four independent western blots are shown in middle (c-MYC) and right (METTL3) panels. D Immunoprecipitation was performed using an antibody recognizing m6A modification (IP) or IgG as negative control, followed by RT-qPCR analysis of c-MYC on recovered RNA samples, in control (siC) and METTL3-silenced (siMETTL3) TC1889 cells (n = 2). E Distribution of c-MYC mRNA, evaluated by RT-qPCR analysis, in ribosomal fractions obtained from control (siC) and METTL3-silenced (siMETTL3) TC1889 cells (48 h). *p ≤ 0.05; **p ≤ 0.005; p-values have been calculated by two-tailed T-test

