
Fig. 1. Dynamic changes in the infant blood transcriptome.
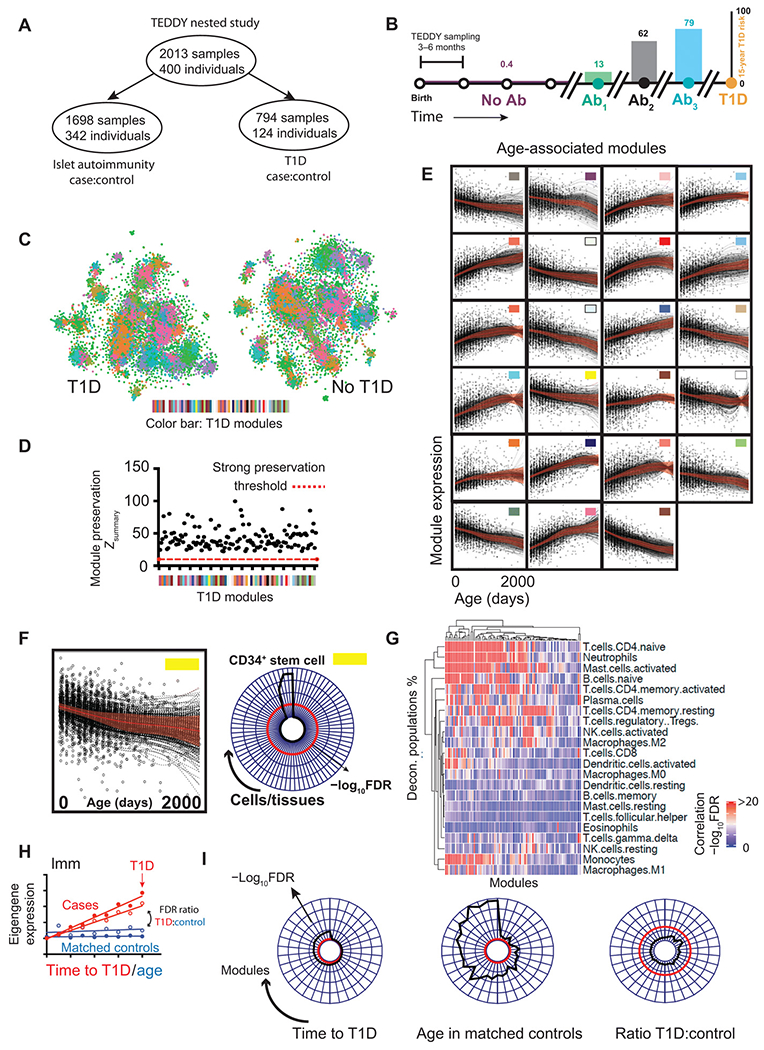
(A and B) Schematic illustration of the (A) TEDDY cohort (B) sampling from birth, through IAbs seroconversion to T1D diagnosis illustrating population-level risFk of T1D. IAb+ samples may appear in both case:control cohorts hence subgroups do not add up to the total. Ab, antibody. (C) tSNE plot illustrating the dissimilarity matrix of gene coexpression networks in T1D (left) and matched controls (right). Each dot represents a distinct gene (n = 15,000). Genes in both plots are colored by modular assignment in the T1D coexpression network. (D) Scatterplot showing strength of T1D module preservation (y axis, Zsummary score) in matched control data (red dashed line = strong preservation threshold, Zsummary = 10). (E) Line and scatterplots showing lmm effects [red, ±95% confidence interval (CI)] and gene expression eigenvalues (black dots) for 23 modular eigengenes showing significant (FDR < 5%) age association in infancy. Colors are matched to (C to E). (F) Example module enrichment: Line and scatterplot (left) showing lmm effects (red line, ±95% CI) for the “yellow” module alongside radar plot (right) showing module enrichment (radial axis, −log10FDR) for cell type–specific transcripts. (G) Clustered heatmap illustrating significance (−log10FDR) of correlation (Pearson) of deconvolved cell subset proportions (y axis) against modular eigengene values (x axis). (H) Schematic line and scatterplot illustrating the use of lmm to compare modular gene expression signatures in matched cases and controls. (I) Radar plots showing all modules (arranged around plot circumference) associated with time to T1D onset (FDR < 5%, left), association of the same modules with sampling age in matched controls (center) and the ratio of observed significance in each (FDRT1D:FDRcontrol, right). For radar plots, radial distance from the center = −log10FDR, red line = threshold FDR < 5%.