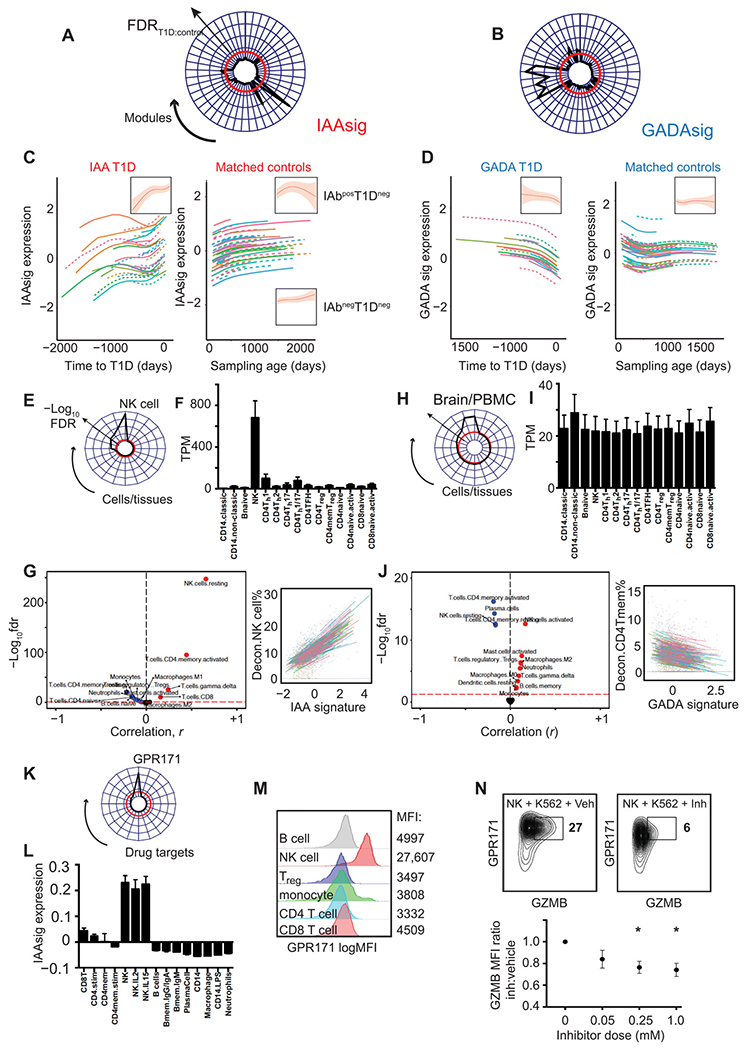
Fig. 2. Age-independent changes in gene expression accompany T1D progression in subgroups defined by first IAbs specificity.

(A and B) Radar plots showing age-corrected associations (Imm FDRT1D:FDRcontrol) of all module eigengenes (shown around plot circumference) with time to T1D onset in IAAs-first (A) and GADA-first (B) cases. Disease specificity indicated by a T1D:control significance ratio > 1 (−log10FDR) = red line. (C and D) Line plots showing individual and summary (inset) effects of natural cubic spline–fitted lmm (±95% CI) fitted to IAAsig (C) or GADAsig (D) eigenvalues in cases (left) and matched controls (right). (E and F) Radar plot (E) and barplot (F) showing IAAs module enrichment for cell type–specific transcripts compared to ARCHS4 (E) and DICE (F) relational databanks. (G) Volcano plot (left) and line plots (right) showing all (left) and selected (right) correlations (Pearson) of IAAsig eigengenes against deconvoluted cell proportions. Significance threshold (FDR < 5%) = red dashed line. (H to J) Radar plot (H) and barplot (I) showing IAAs module enrichment for cell type–specific transcripts compared to ARCHS4 (H) and DICE (I) relational databanks. (J) Volcano plot (left) and line plots (right) showing all (left) and selected (right) correlations (Pearson) of GADAsig eigengenes against deconvoluted cell proportions. Significance threshold (FDR < 5%) = red dashed line. For barplots (F and I), TPM, transcripts per million reads; expression (means ± SEM) of IAAsig (F) and GADAsig (I) per cell type is shown. (K) Radar plot showing enrichment (−log10FDR) of IAAsig genes against 352 druggable targets linked to 20,883 genes from the IDG repository. Drug targets showing any overlap with IAAsig genes are included around the radar plot circumference. (L) Barplot (means ± SEM, n = 3 to 12 per group) showing IAAsig eigengene expression and (M) representative histograms showing GPR171 surface protein expression in circulating immune cell subsets (GSE22886). (N) Representative contour plot (top) and scatterplot (bottom) showing GPR171 surface protein expression (y axis, log10 MFI) and Granzyme B (GZMB) protein expression (x axis) after coculture of purified primary human NK cells with K562 target cells along with vehicle (left) or a titrated dose range of specific GPR171 inhibitor (Inh; right). *P < 0.05, MFI, median fluorescence index; Treg, regulatory T cell.
