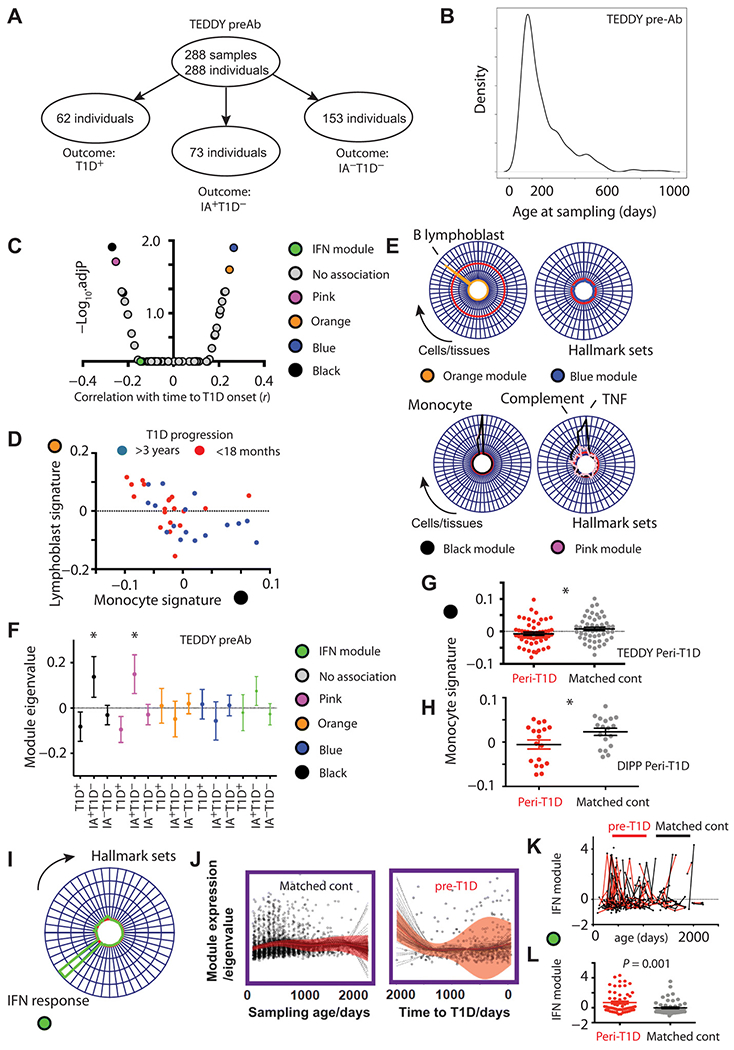
Fig. 4. Preseroconversion gene expression changes associate with rate of T1D progression.

(A) Schematic illustration and (B) density plot showing age distribution of earliest preseroconversion samples taken in the TEDDY transcriptomic study (TEDDY preAb). “Outcome” indicates later progression rather than state at time of sampling. (C) Volcano plot showing correlation of all network modules (x axis, r) against adjusted significance (−log10FDR, y axis). (D) Scatterplot illustrating inverse correlation of B lymphoblast (orange) and monocyte (black) modular signatures and their association with rate of T1D progression. (E) Radar plots illustrating enrichment of the orange and blue (top) and black and pink (bottom) modules against the human cell atlas (left) and hallmark signature sets (right). Radial axis = −log10FDR, red line = significance threshold FDR (5%). (F) Scatterplot illustrating expression (means ± SEM) of black, pink, orange, and blue, and IFN response signatures by outcome group in the TEDDY preAb cohort, * = Mann Whitney P < 0.05. Outcome group reflects final clinical status rather than status at the time of sampling. (G) Scatterplot showing age-corrected eigengene expression of the “black” monocyte/TNF-enriched signature in pre-T1D samples from TEDDY (n = 54 samples within 12 months before diagnosis). (H) Scatterplot showing age-corrected eigengene expression of the black monocyte/TNF-enriched signature in pre-T1D samples from the DIPP cohort (n = 18 samples within 3 months before diagnosis) and their matched controls (n = 18). (I) Radar plot showing modular enrichment for interferon (IFN) response transcripts. (J) Scatterplot and line plot showing lmm summary of longitudinal type1 IFN module expression (red line, ± 95% CI shaded) in pre-T1D children (right, n = 62) and matched controls (left, n = 62). (K) Scatter and line plot illustrating spikes of type 1 IFN response module and (L) age-matched peak expression in pre-T1D (red, n = 57) and age-matched control samples (black, n = 57) in the 12-month preceding T1D onset.
