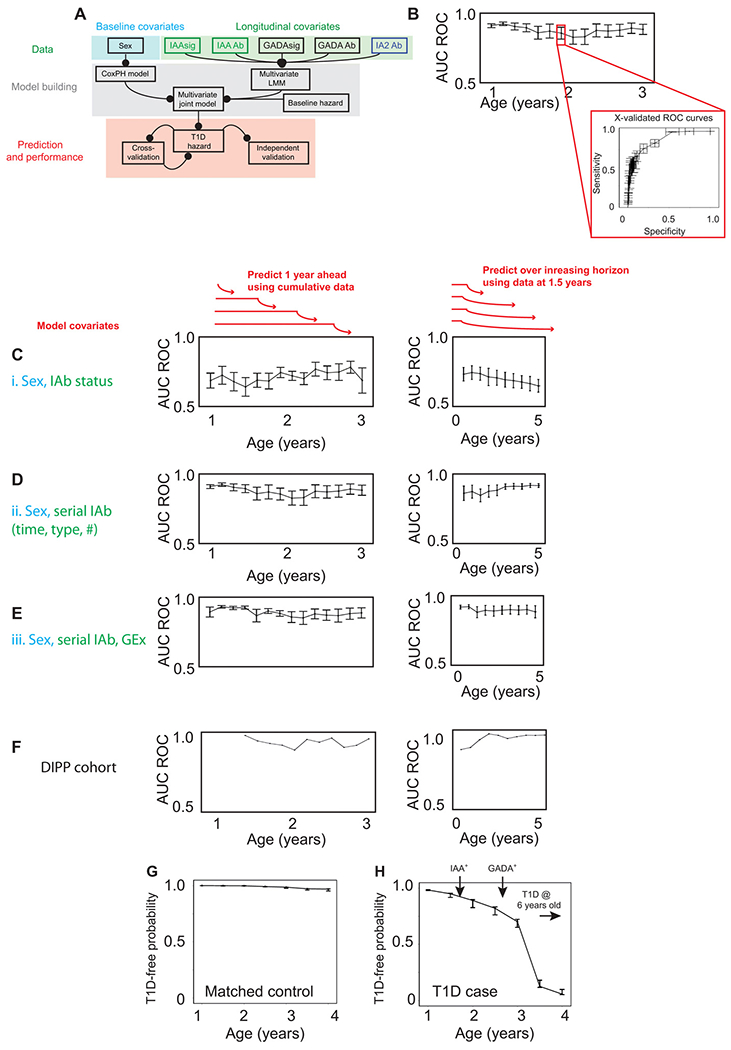
Fig. 5. Validated prediction of T1D hazard in at-risk infants.

(A) Schematic of multivariate Bayesian joint model data input (top), model building (middle), and model performance assessment (bottom). (B) Illustration of cross-validation method used on discovery TEDDY cohort. (C to F) Line and scatterplots showing predictive accuracy of models applied to each of two clinical scenarios (schematically illustrated above plots in red). Left: Serial prediction over future 12-month horizon using cumulative data. Right: Serial prediction over extended future horizon using fixed data. (C) Model i incorporating IAbs status (IAb+/−) only. (D) Model ii incorporating longitudinal IAbs type, status, timing, and interaction effects. (E) Model iii incorporating model ii plus IAAsig/GADAsig and interaction effects. Predictive accuracy (AUC ROC) determined through 10-fold cross-validation on the discovery TEDDY dataset as illustrated in (B). (F) Predictive accuracy (AUC ROC) of independent validation of model iii on the DIPP dataset. (G and H) Representative line and scatterplots illustrating serial prediction of individual T1D risk for a T1D case (G) and matched control (H) with predictions every 6 months, made over a horizon of 1 year. Error bars represent means ± SEM. Arrows indicate timing of seroconversion events.
