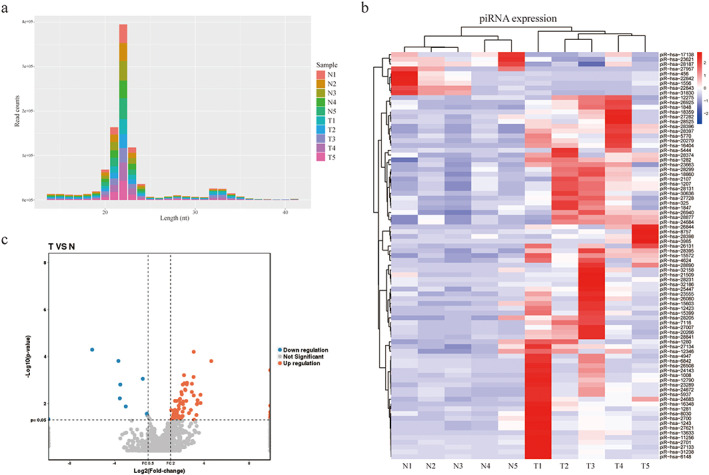
FIGURE 1.

The analysis of dysregulated piRNAs in LUAD patients. (a) Bar graph of small RNA transcripts identified from LUAD patient's tissue samples. (b,c) The heatmap (b) and volcano plots (c) of 85 differently expressed piRNAs in LUAD patients. T, LUAD tissues; N, paired adjacent non‐tumor tissues
