
FIGURE 2.
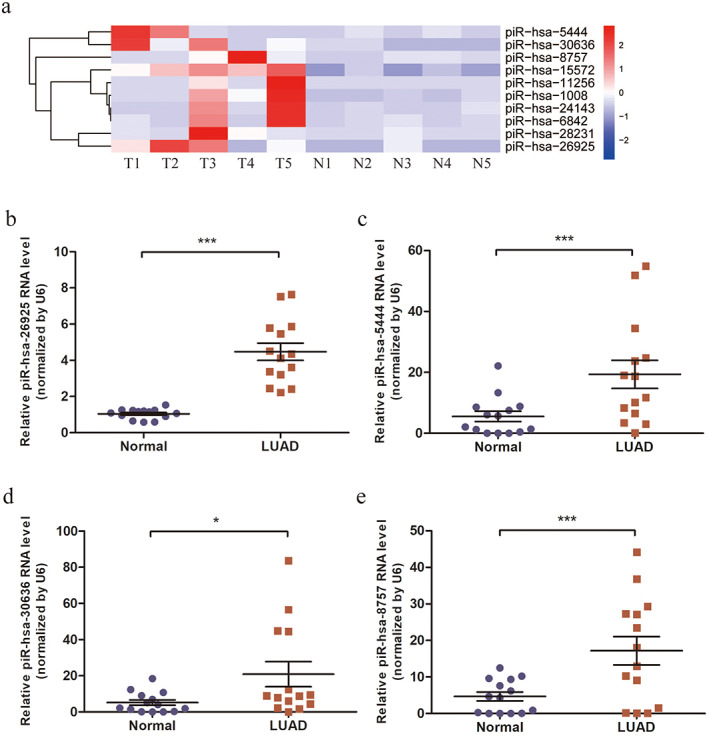
Screening and verification of candidate upregulated piRNAs in tissues. (a) Heatmap of top 10 candidate piRNAs with statistical significance. T, LUAD tissues; N, paired adjacent non‐tumor tissues. (b–e) Relative expressions of piR‐hsa‐26925 (b), piR‐hsa‐5444 (c), piR‐hsa‐30636 (d) and piR‐hsa‐8757 (e) in LUAD patients. *p < 0.05, ***p < 0.001