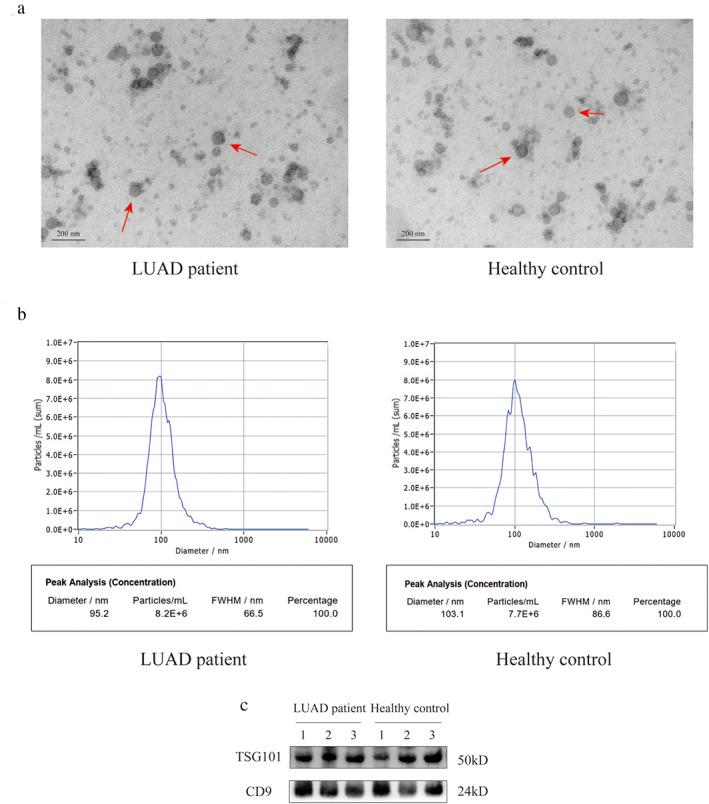
FIGURE 3.

Characterization of serum exosomes. (a) TEM images of exosomes isolated and detected from serum samples (scale bar, 200 nm). (b) the NTA showed the size distribution and the number of serum exosomes. (c) Western blot analysis of exosomal markers, including TSG101 and CD9
