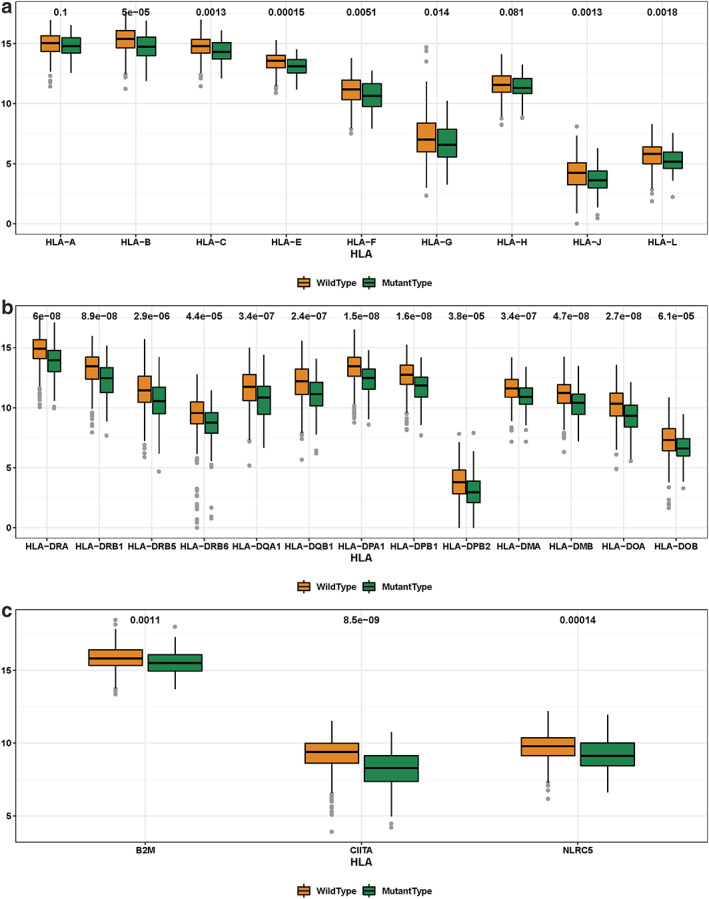
FIGURE 2.

Association of KEAP1 mutation and HLA expression. (a) Boxplot shows expression of the type 1 HLA molecules in KEAP1‐wild type and KEAP1‐mutated LUADs. (b) Boxplot shows the expression of the type 2 HLA molecules in KEAP1‐wild type and KEAP1‐mutated LUADs. (c) Boxplot shows the expression of three important HLA related genes in KEAP1‐wild type and KEAP1‐mutated LUADs. The numeric above the boxplot indicates adjusted p‐value. Wilcoxon rank‐sum test was used to compare difference, and p‐value was adjusted with Benjamini–Hochberg method
