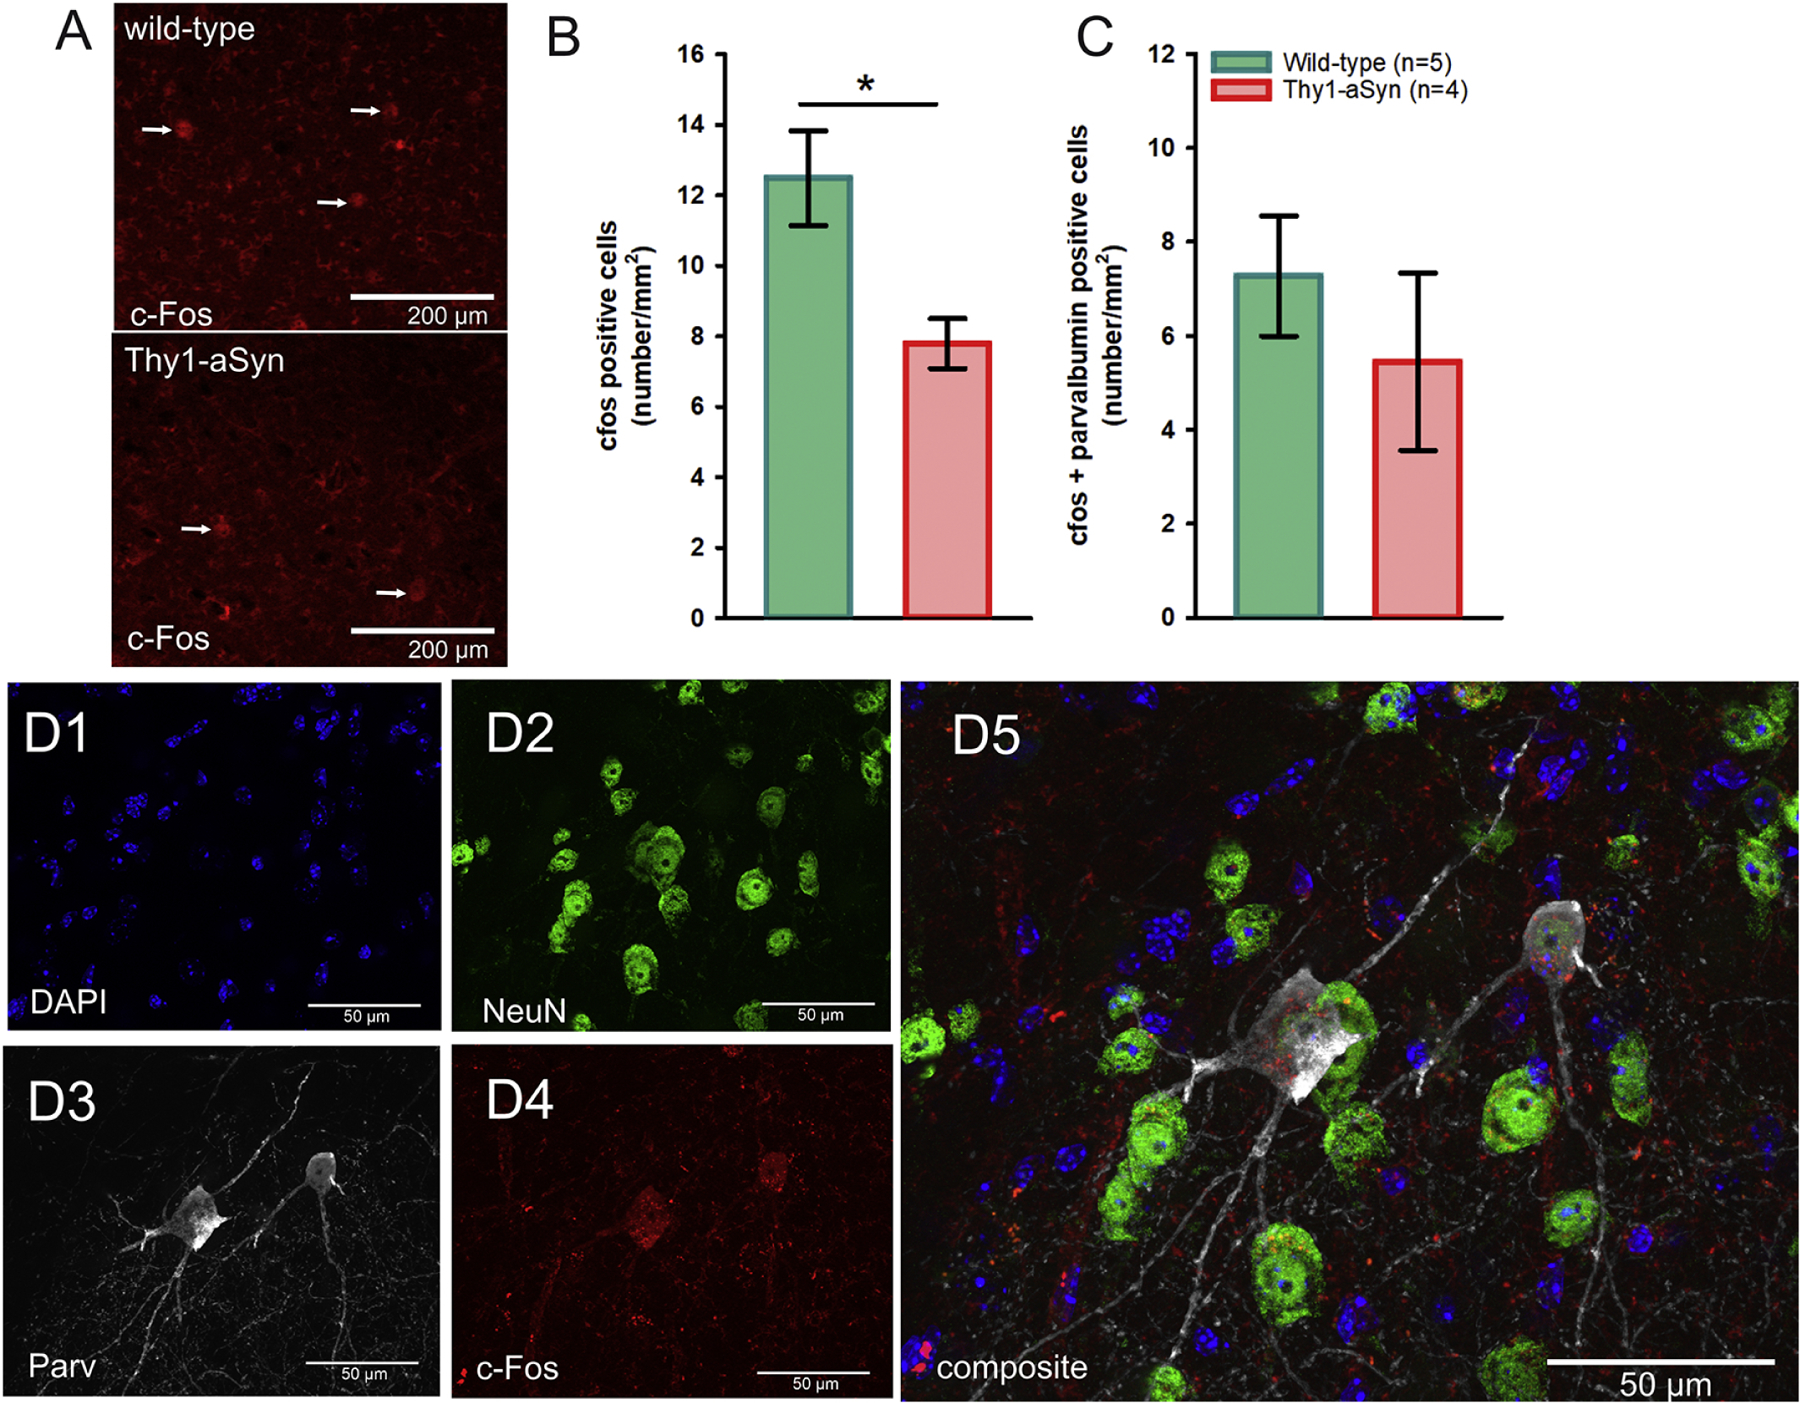
Fig. 10.

Immunofluorescent (IF) c-Fos staining of amygdala sections from wild-type and Thy1-aSyn mice. A) Representative IF microphotographs of c-Fos positive cells in wild-type and Thy1-aSyn mice (white arrows), B) Quantification of c-Fos positive and C) c-Fos/Parv double-positive cells in the BLA (mean ± SEM, Student’s t-test; *p < 0.05, N is given in the bar graph). D1–5) DAPI (blue), NeuN (green), parvalbumin (Parv, grey), c-Fos (red) and merged images of the BLA from a representative Thy1-aSyn mouse demonstrates c-Fos and parvalbumin co-localization (scale bar = 50 µm).
