Fig. 8.

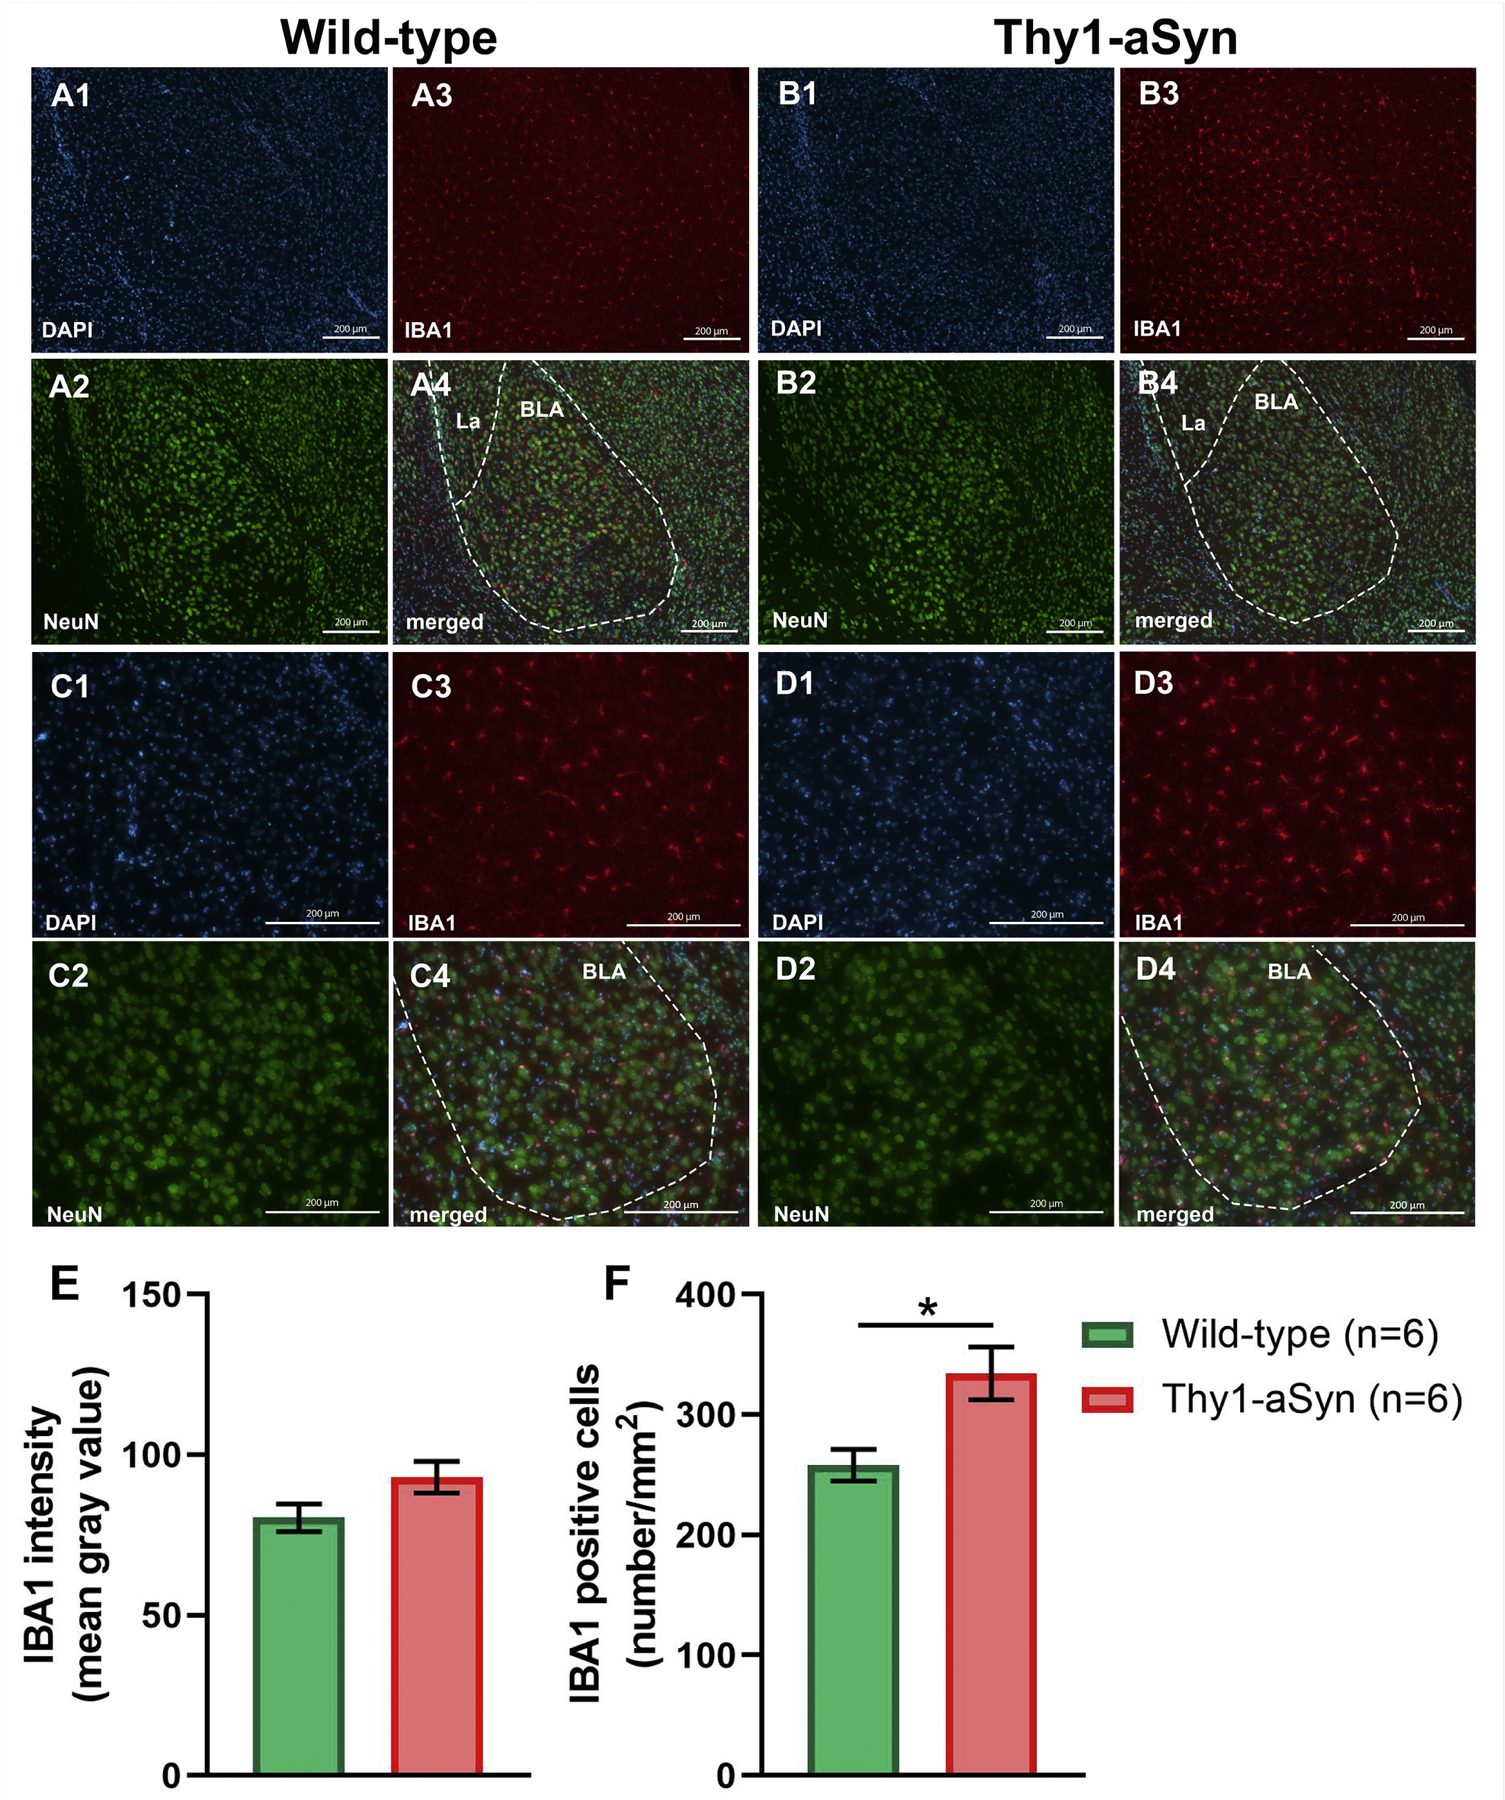
Immunofluorescent (IF) NeuN and IBA-1 staining of amygdala sections from wild-type (WT) and Thy1-aSyn (TG) mice. Representative IF microphotographs of DAPI (blue), NeuN (green), IBA-1 (red) and merged IF images of the 6-months WT (A, C) and TG mice (B, D). Representative (10×) IF images (A, B) of basolateral nucleus of the amygdala (BLA). Representative (20×) IF images of BLA (C, D). Image-J was used to quantify the IF intensity of IBA-1 staining and density IBA-1 positive cells. Change in expression of IBA-1 (E) was not observed between experimental groups. Increased density of IBA-1 positive cells was observed in TG mice compared to WT mice (F). (mean ± SEM, n = 6/group; Student’s t-test; *p < 0.05) Lateral amygdaloid nuclei (La), scale bar = 200 µm.
