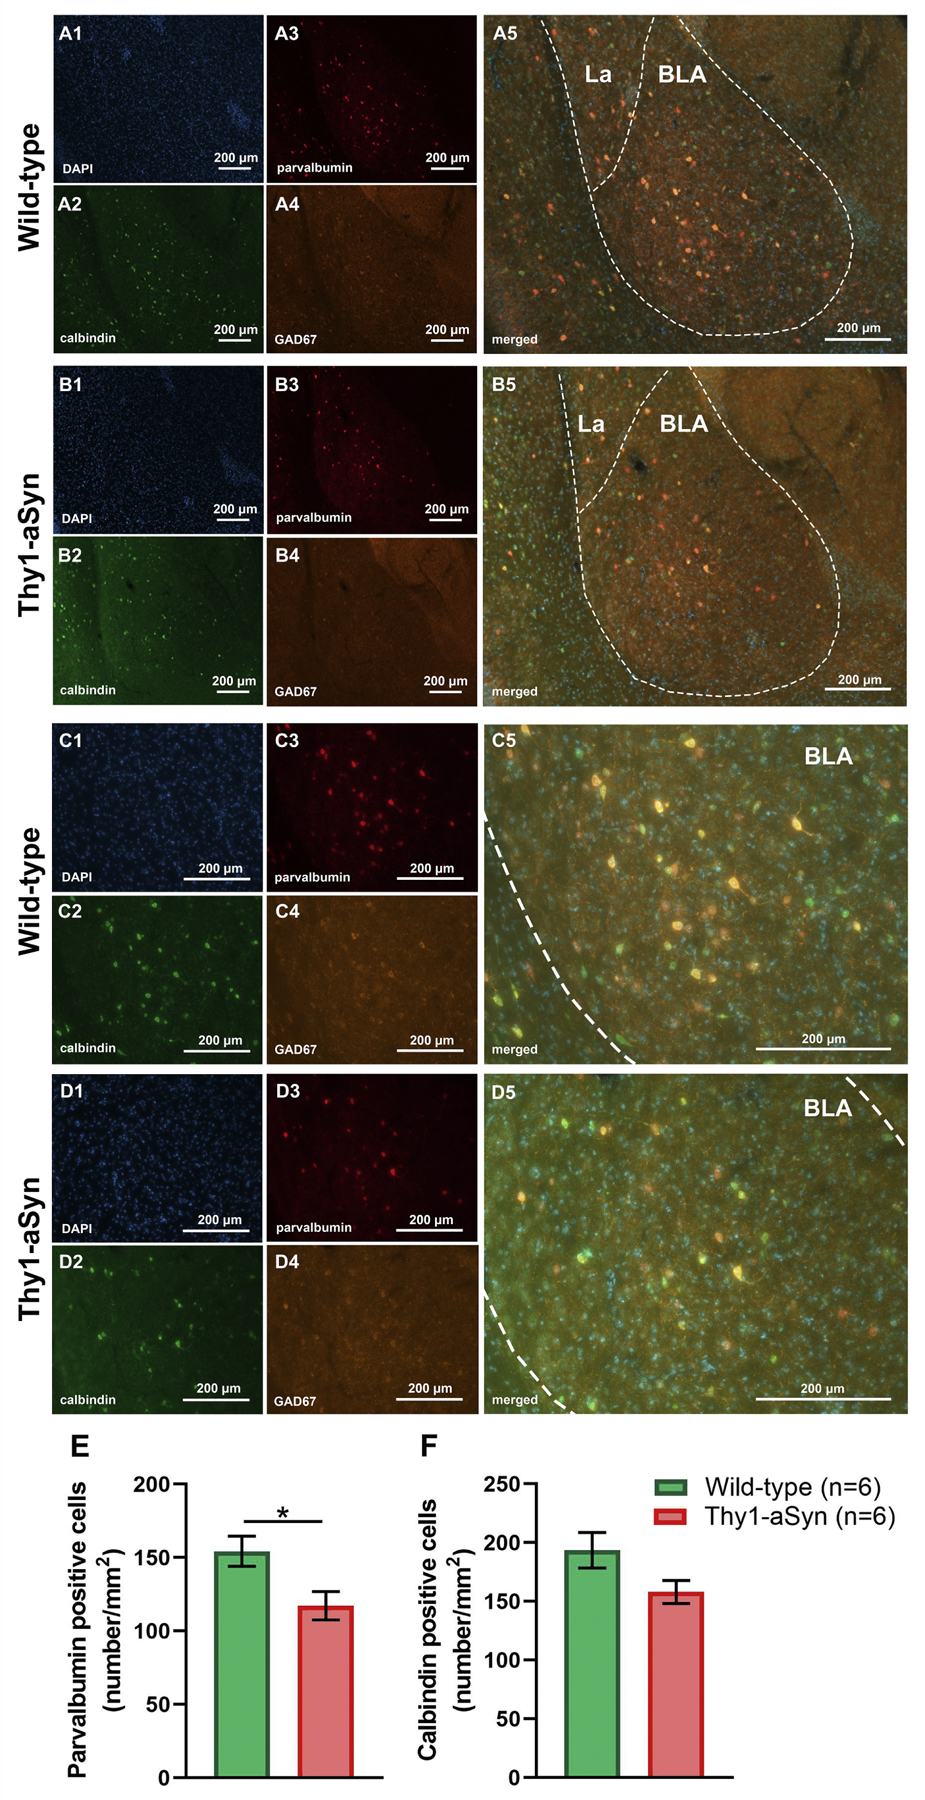
Fig. 9.

Immunofluorescent (IF) calbindin, parvalbumin and GAD67 staining of amygdala sections from wild-type (WT) and Thy1-aSyn (TG) mice. Representative IF microphotographs of DAPI (blue), calbindin (green), GAD67 (orange), parvalbumin (red) and merged IF images of the 6-mo WT (A, C) and TG mice (B, D). Representative (10×) IF images (A, B) of basolateral nucleus of the amygdala (BLA). Representative (20×) IF images of BLA (C, D). Reduction of parvalbumin but not calbindin positive cell density was observed in TG mice compared to WT mice (E, F). (mean ± SEM, n = 6/group; Student’s t-test; *p < 0.05) Lateral amygdaloid nuclei (La), scale bar = 200 µm.
