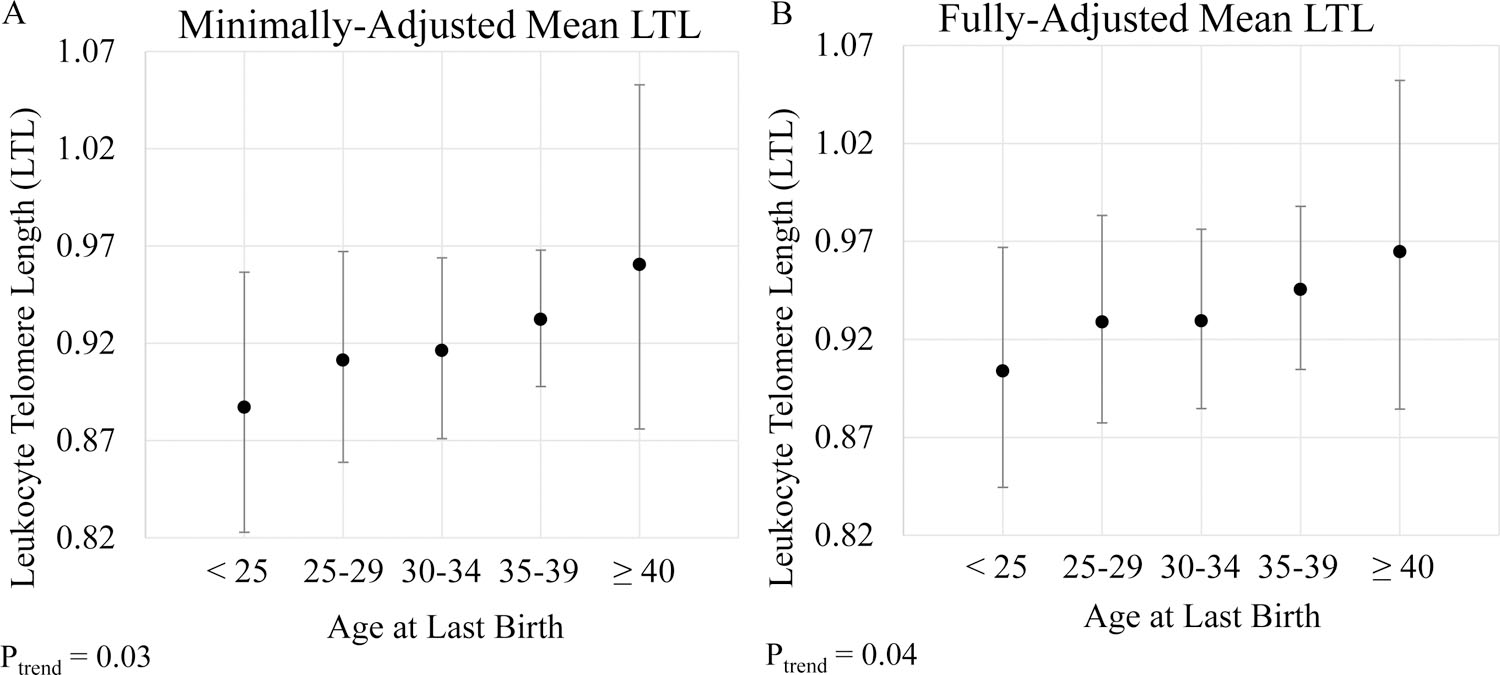
Figure 2.

Estimated geometric mean leukocyte telomere length (Y-axis) with 95% confidence intervals across categories of age at last live birth (X-axis) in the entire study population (n = 1,232). (A) Adjusted for age at blood collection (continuous) and race/ethnicity (non-Hispanic white, non-Hispanic black, Mexican American, Other Hispanic, Other race/mixed). (B) Adjusted for age at blood collection (continuous); race/ethnicity (non-Hispanic white, non-Hispanic black, Mexican American, Other Hispanic, Other race/mixed); number of live births (1, 2, 3, 4, ≥ 5); history of hysterectomy and/or oophorectomy after 40 years of age (ever, never); and survey cycle (1999–2000, 2001–2002). P for trend are 2-sided and obtained by modeling age at last birth as an ordinal variable.
