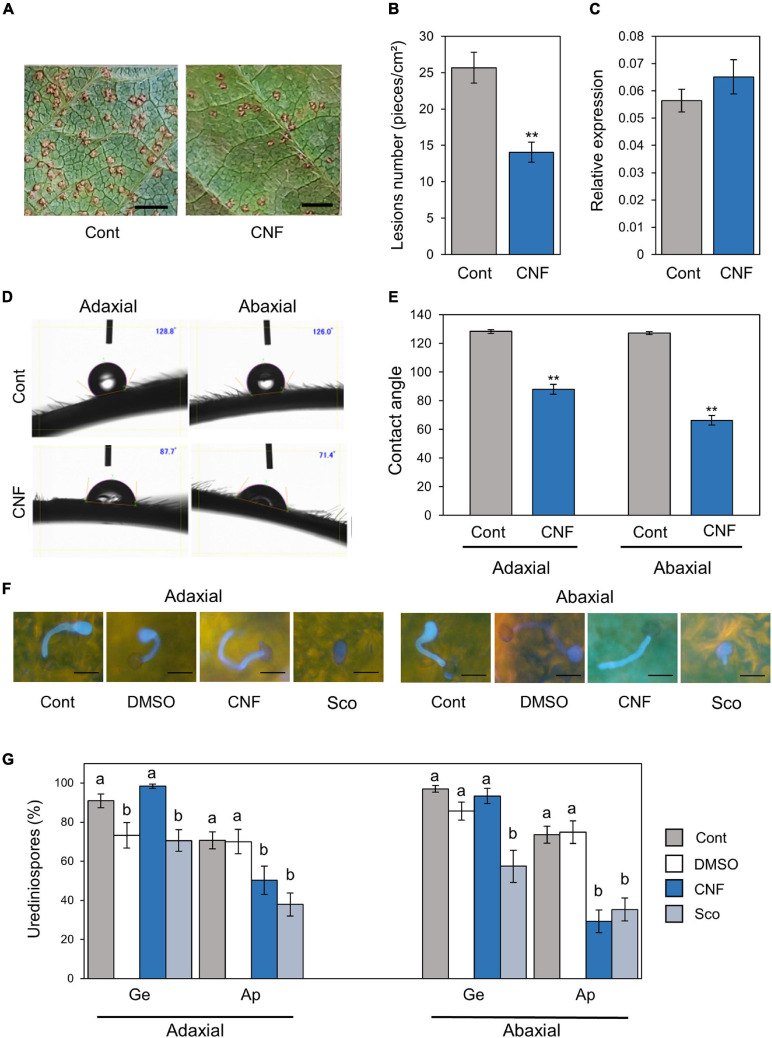
FIGURE 1.
Phakopsora pachyrhizi lesion formation, pre-infection structures formation, and hydrophobicity on CNF-treated soybean leaves. Disease lesions (A) and lesion numbers (B) resulting from P. pachyrhizi infection on the abaxial leaf surface of control, and leaves covered with 0.1% cellulose nanofiber (CNF). Soybean plants were spray-inoculated with P. pachyrhizi (1 × 10⁵ spores/ml). Photographs were taken 10 days after inoculation. Bars indicate 0.2 cm. Lesion numbers were counted to calculate lesion number per cm2. Vertical bars indicate the standard error of the means (n = 54). Asterisks indicate a significant difference between control and CNF-treatments in a t-test (**p < 0.01). (C) Urediniospore attachment quantification on the leaf surface of control and leaves covered with 0.1% CNF derived. Soybean plants were spray-inoculated with P. pachyrhizi (1 × 10⁵ spores/ml) and immediately total RNAs including soybean and P. pachyrhizi were purified. Relative expression of soybean ubiquitin 3 (GmUBQ3) and P. pachyrhizi ubiquitin 5 (PpUBQ5) were evaluated using RT-qPCR. Vertical bars indicate the standard error of the means (n = 4). Droplet profiles (D) and quantification of contact angles (E) on the adaxial and abaxial leaf surface of control, and leaves covered with 0.1% CNF derived. Contact angles were evaluated as described in section “Materials and Methods”. Vertical bars indicate the standard error of the means (n = 60). Asterisks indicate a significant difference between control and CNF-treatments in a t-test (**p < 0.01). P. pachyrhizi pre-infection structure formation (F) and percentage of urediniospores (G) on the adaxial and abaxial surfaces of control, and leaves covered with 0.1% CNF, treated with 0.1% DMSO and 500 mM scopoletin (Sco). Soybean plants were spray-inoculated with P. pachyrhizi (1 × 10⁵ spores/ml). The pre-infection structures were stained with Calcofluor White and photographs were taken 6 h after inoculation. Bars indicate 50 μm. The percentage of germinated (Ge) urediniospores and differentiated germ-tubes with appressoria (Ap) were evaluated as described in section “Materials and Methods.” Vertical bars indicate the standard error of the means (n = 21). Significant differences (p < 0.05) are indicated by different letters based on a Tukey’s honestly significant difference (HSD) test.

