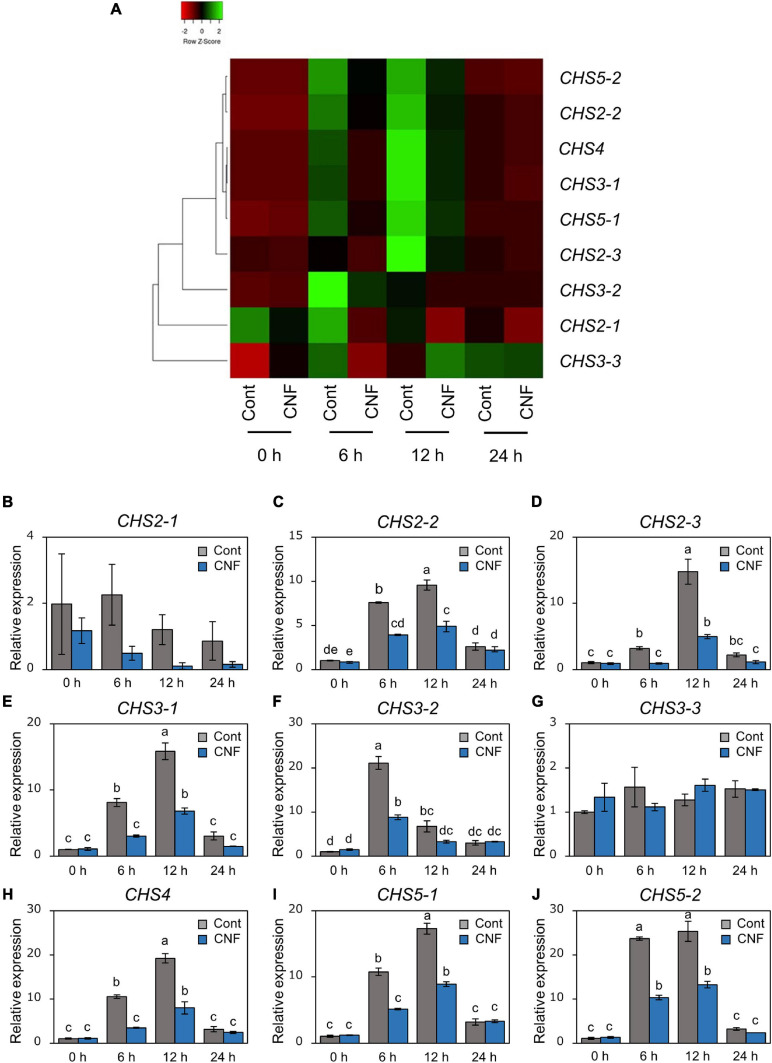
FIGURE 5.
Gene expression profiles of P. pachyrhizi chitin synthase genes on CNF-treated soybean leaves. (A) The heatmap was created from gene expression profiles of P. pachyrhizi chitin synthases, including CHS2-1, CHS2-2, CHS2-3, CHS3-1, CHS3-2, CHS3-3, CHS4, CHS5-1, and CHS5-2 on soybean leaves covered with or without 0.1% CNF. Soybean plants were spray-inoculated with P. pachyrhizi (1 × 10⁵ spores/ml). Total RNAs including soybean and P. pachyrhizi were purified at 0, 6, 12, and 24 h after inoculation, and expression profiles were evaluated using RT-qPCR. P. pachyrhizi elongation factor 1α (PpEF1α) and ubiquitin 5 (PpUBQ5) were used to normalize the samples. Expression profiles were visualized as a heatmap using Heatmapper (Babicki et al., 2016). Gene expression profiles of P. pachyrhizi chitin synthases, including CHS2-1 (B), CHS2-2 (C), CHS2-3 (D), CHS3-1 (E), CHS3-2 (F), CHS3-3 (G), CHS4 (H), CHS5-1 (I), and CHS5-2 (J) on soybean leaves covered with or without 0.1% cellulose nanofiber (CNF). Vertical bars indicate the standard error of the means (n = 4). Significant differences (p < 0.05) are indicated by different letters based on a Tukey’s honestly significant difference (HSD) test.

