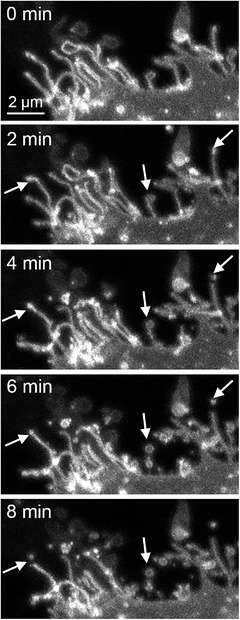
FIGURE 6.

Confocal time‐lapse live‐cell imaging demonstrates the shedding of EVs from the tips of plasma membrane protrusions (arrows). Images in all time points show 3D maximum intensity projections created from stacks of confocal optical sections. One edge of a live MCF7 breast cancer cell is shown
