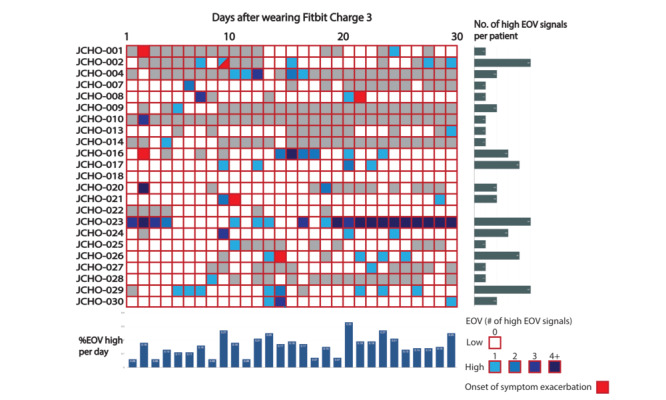
Figure 3.

Summary of high estimated oxygen variation (EOV) signals and events among patients with a positive SARS-CoV-2 polymerase chain reaction test. The vertical columns represent the ID of each patient, and the horizontal axis represents the number of days of wearing a Fitbit. Blue squares represent a single-day high EOV signal. Gray columns denote the days when no EOV data were obtained. Red columns indicate the days that primary outcomes (symptom exacerbation events) occurred. JCHO: Japan Community Health Care Organization.
