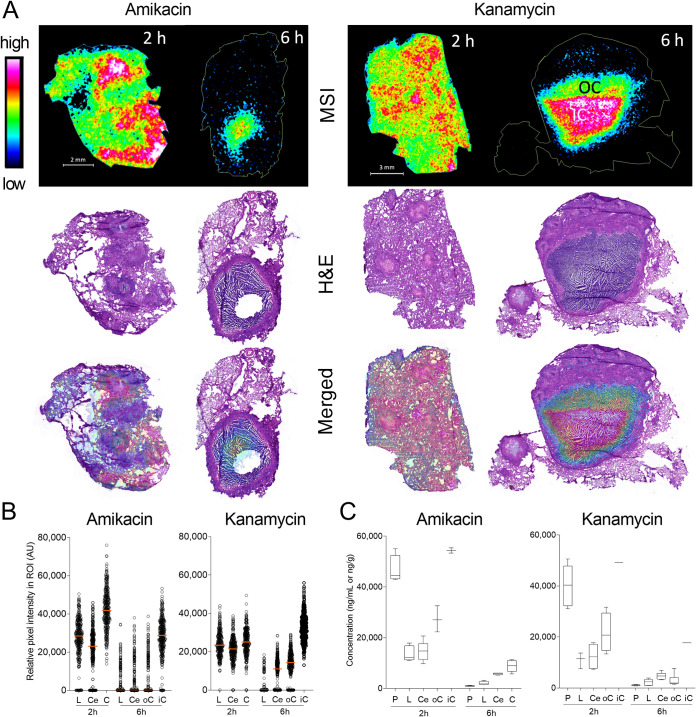
FIG 1.
Distribution of KAN and AMK in lung, necrotic lesions, and cavities. (A) MALDI mass spectrometry (MS) ion maps of AMK and KAN in representative rabbit lung tissues collected 2 h and 6 h postdose at steady state. MS images of AMK and KAN distribution are displayed on the top. The hematoxylin and eosin (H&E) stains of the sections used for MSI are shown in the middle, and merged H&E and MS images are on the bottom; OC, outer caseum; IC, inner caseum. (B) Scatterplots of relative pixel (50 × 50 mm) intensities within regions of interest (ROI) drawn to encompass approximately 350 pixels within lung and lesion compartments as indicated; L, uninvolved lung; Ce, cellular rim; oC, outer caseum; iC, inner caseum. (C) Absolute concentrations of AMK and KAN in plasma and infected lung regions determined by laser-capture microdissection and LC/MS-MS; P, plasma; L, uninvolved lung; Ce, cellular rim; C, caseum; oC, outer caseum; iC, inner caseum.

