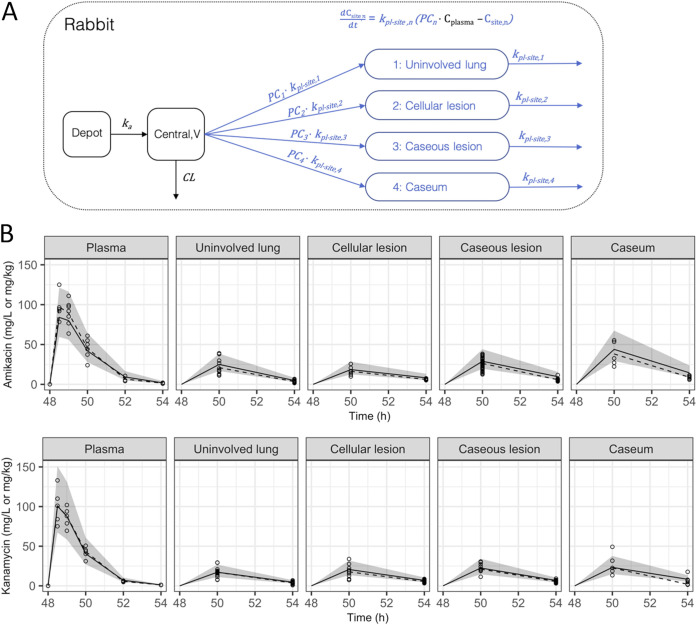
FIG 3.
Model structure and visual predictive checks (VPC) for plasma-to-tissue distribution of AMK and KAN. (A) Model structure for the rabbit plasma and site-of-action PK. (B) Scatter VPC of rabbit plasma-to-tissue model for AMK and KAN. Points and dashed lines represent observed data points and median of observed data, respectively. Shaded area and solid lines represent the 90% prediction interval and the median of 1,000 simulations, respectively; ka, rate of absorption; V, central volume of distribution; CL, clearance; PC, partition coefficient or the ratio of drug at site compared to plasma; kpl-site, distribution rate constant; Cplasma, concentration in plasma; Csite, concentration at site of action.

