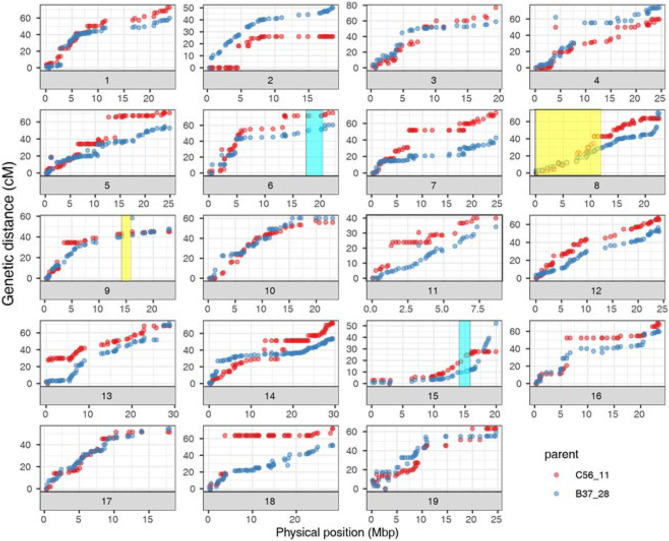
Figure 2.
Correlation of B37-28 × C56-11 parental genetic maps and PN40024 12X.v2 physical maps for the 19 chromosomes (Chr). Four quantitative trait loci (QTLs) that were found two or more times are shown as transparent boxes in yellow for stems (Chr 8 and 9) and blue for all four tissues (Chr 15) or all tissues except berries (Chr 6).

