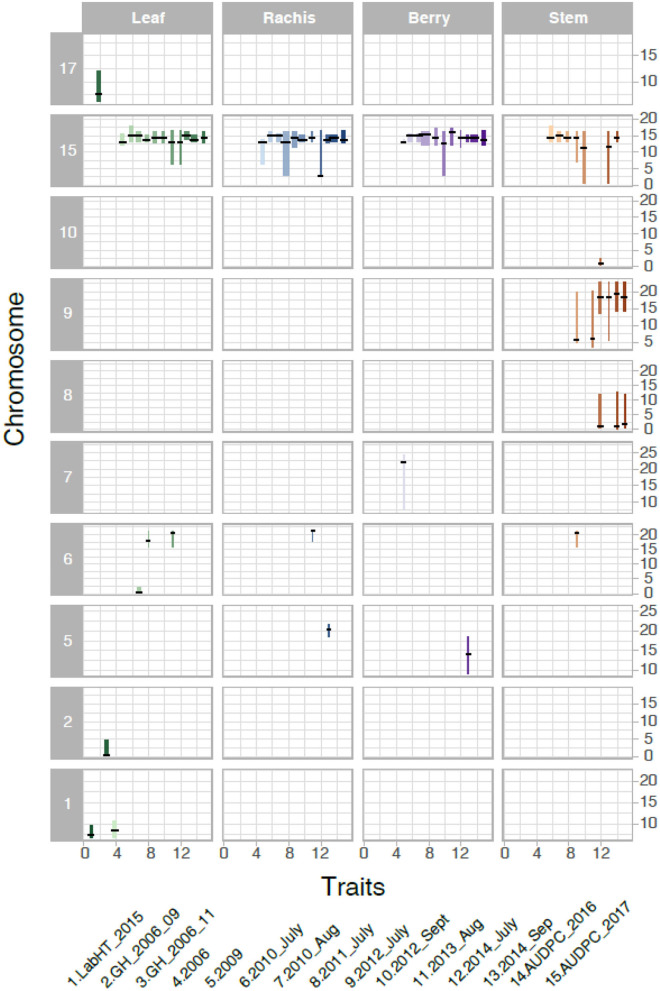
Figure 3.
Significant Quantitative trait locus (QTL) for powdery mildew severity by tissue in B37-28 × C56-11. The 15 powdery mildew traits (or environments) analyzed correspond to numbers on the x-axis, with traits 4–13 corresponding to vineyard disease ratings on a 1–4 scale. The vertical interval of each line shows the chromosome Mbp region of the QTL, with a crosshatch at the QTL peak. The thickness of the line indicates the percent variance explained by the peak marker.

