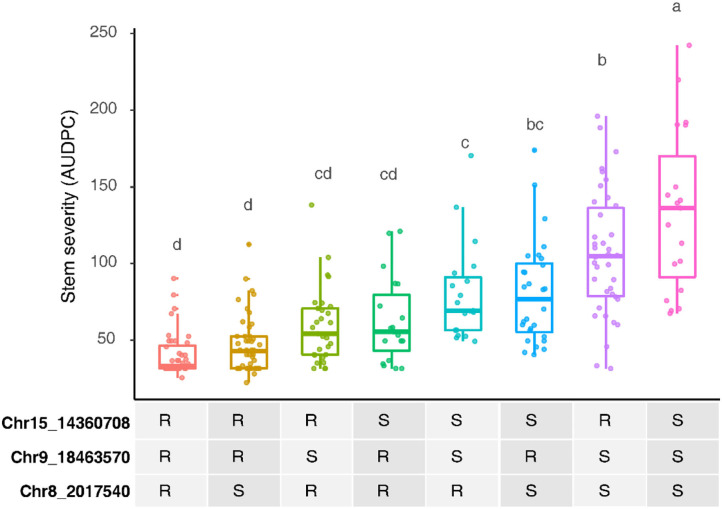
Figure 4.
Additive effects of the powdery mildew resistance alleles on stems in B37-28 × C56-11, assessed by area under disease progress curve (AUDPC) BLUEs for 2016 and 2017 combined. For the three peak markers, R, resistant haplotype and S, susceptible haplotype. Letters above each box indicate statistically significant differences detected by Fisher's least significant difference test with Bonferroni corrections.

