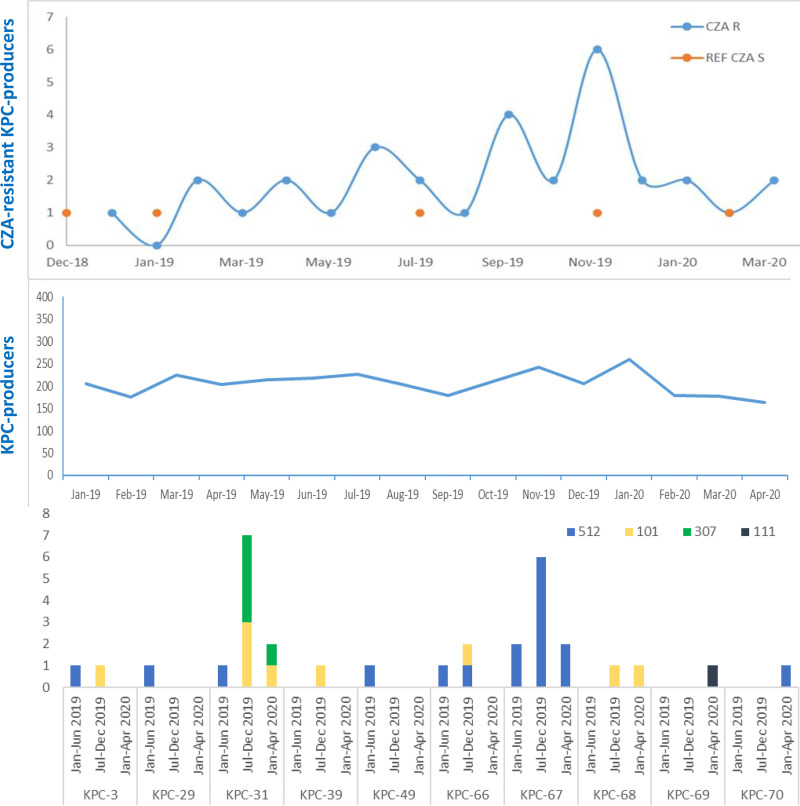
FIG 2.
Epidemiological analysis of isolates along the time of surveillance and distribution of the ceftazidime-avibactam-resistant KPC variants per Klebsiella pneumoniae sequence type. The blue curves represent the number of isolates per month of KPC producers and CZA-resistant KPC producers (blue line with blue dots), respectively, during the January 2019 to April 2020 period. Orange dots represent the CZA-susceptible strains collected during the surveillance and used as controls for genomic comparison. Bars represent the distribution of the variants per ST in the three surveillance periods: January to June 2019, July to December 2019, and January 2020 to April 2020.

