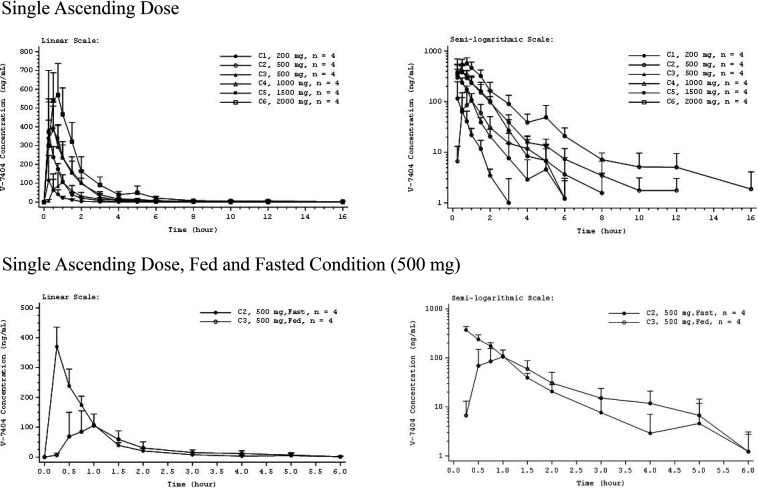
FIG 2.
Mean V-7404 plasma concentration-time profiles for single ascending dose. Error bars indicate standard deviation (SD). Mean values BLQ were treated as zero for plotting purposes. The x axis is truncated at the time of the last quantifiable mean. BLQ, below the lower limit of quantification (LLOQ; 1.00 ng/ml); C, cohort.

