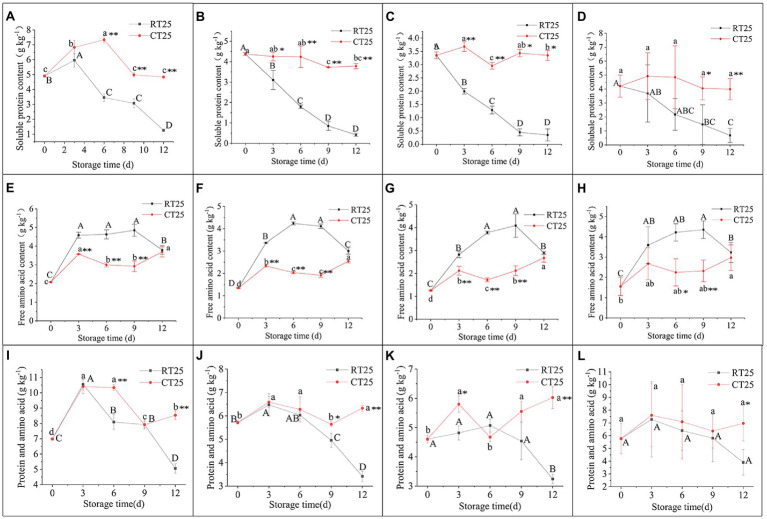
Figure 8.
Dynamic changes in soluble protein, free amino acid, and PA (soluble protein and free amino acid) content in shoots stored at 25°C and 4°C. RT25, bamboo shoots stored at room temperature and analyzed at 25°C; CT25, bamboo shoots stored at cold temperature and analyzed at 25°C. (A–D) Soluble protein content in shoots during storage for upper (A), middle (B), and bottom (C) plant parts, and mean values (D). (E–H) Free amino acid content in shoots during storage for upper (E), middle (F), and bottom (G) plant parts, and mean values (H). (I–L) PA content in shoots during storage for upper (I), middle (J), and bottom (K) plant parts, and mean values (L). Data are presented as mean±standard deviation (n=3). Significant analysis was performed using the Student’s t-test, in which different letters represent significant difference between treatments within the group, and the asterisk represents the level of significance between groups (*means the difference is significant at the 0.05 level, **means the difference is significant at the 0.01 level).

