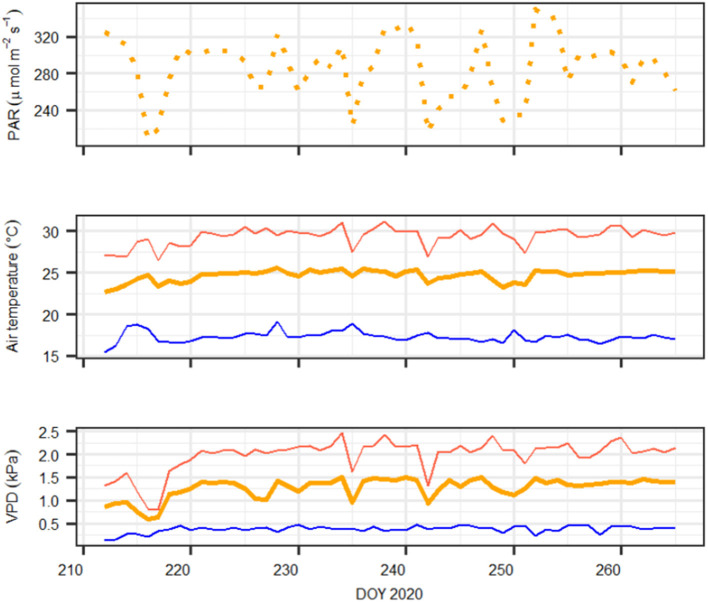
Figure 1.
Daily meteorological conditions during the experiment. Upper panel: daylight average photosynthetic active radiation (PAR, in μmol m−2 s−1); middle panel: maximum (red), minimum (blue), and average (orange) air temperature (in °C); bottom panel: maximum (red), minimum (blue), and average (orange) atmospheric vapor pressure deficit (VPD, in kPa). Note that on DOY 216–217, vapor pressure deficit (VPD) and temperature conditions were lowest because of a cold weather front that was not compensated by heating the greenhouse.

