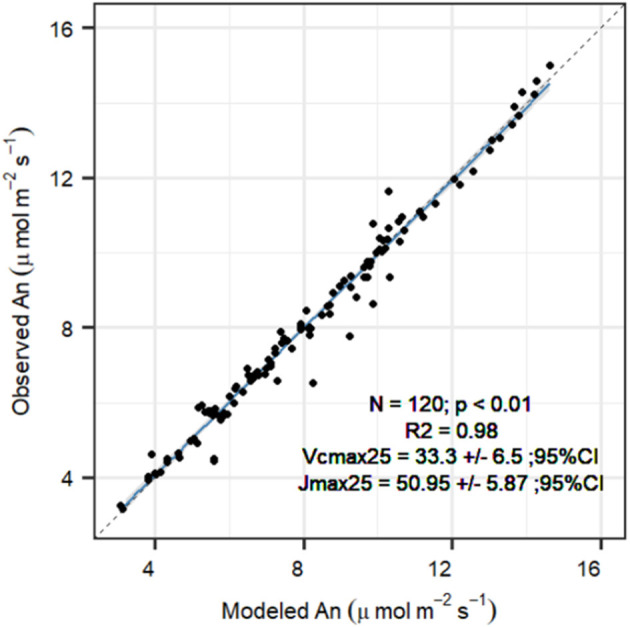
Figure 3.

Comparison between FvCB model net assimilation (An, μmol m−2 s−1) projections with observations after parameter optimization for each An/Ci curve (n = 19), for the P. sylvestris saplings grown in the greenhouse in year 2019. Reported are the fit (R2), the median optimum Vcmax,25 ± 95% confidence interval, and the median optimum Jmax,25 ± 95% confidence interval. The solid line indicates the trend between observed and modeled An (p < 0.01), with the gray area representing the 95% CI. The slope was not significantly different than 1 (p > 0.1), and intercept was not significantly different than 0 (p > 0.1) based on a t-test. Dashed line represents the 1:1 fit.
