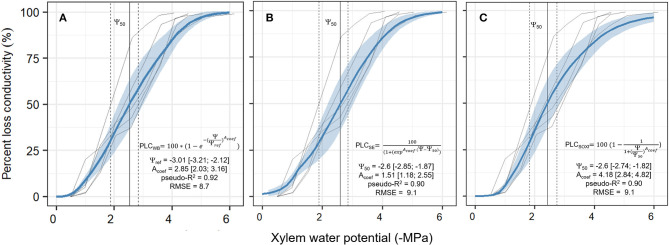
Figure 4.
Calibration of the three different xylem vulnerability models [Weibull model (WB, A), the Sigmoid Exponential (SE, B), and the original SOX formulation (SOXf, C)] for the P. sylvestris saplings. Solid transparent lines are the five measured curves of the observed percent loss in xylem conductivity (PLC, in %) in relation to xylem water potential decrease (Ψxylem, in -MPa). Solid blue line ± shadowed blue area is the median ± 95 CI obtained from 1 k model runs sampling the combined posterior parameter estimate, resulting from curve-individual calibrations for each model, as described in section Xylem Vulnerability. The vertical solid line shows the Ψ50 value; this is when xylem has lost 50% of its conductivity (±95% CI, vertical dashed lines). For each model, formulation and median ± 95% CI values for each parameter are provided. Note that in the WB model Ψref parameter meaning is not equivalent to the Ψ50 parameter from the other two models. Goodness of fit is given as the median pseudo-R2 and the median root mean square error (RMSE) of all model runs.

