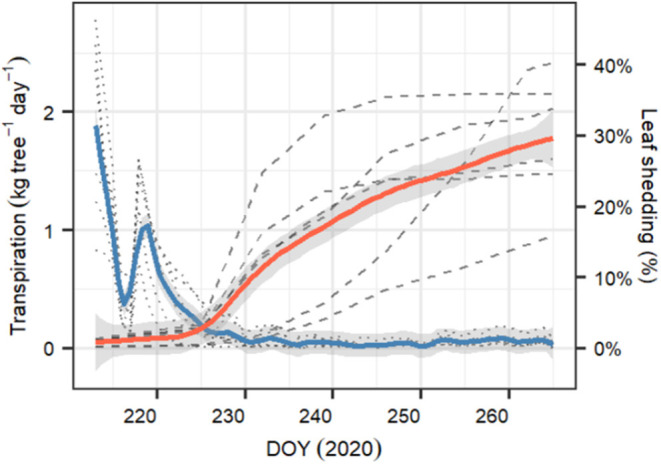
Figure 5.

Temporal evolution of whole-tree transpiration (in kg tree−1 day−1) and percent of leaf shed for the six monitored P. sylvestris saplings growing in the greenhouse during the whole length of the experiment (DOY 212–265). Blue line represents the average daily transpiration ±1 SD, whereas red line represents the daily cumulated percent of leaf shed since the beginning of the experiment ±1 SD. Transparent dotted lines are the observed daily transpiration for each tree, and transparent dashed lines are the cumulated percent of leaf shed for each tree.
