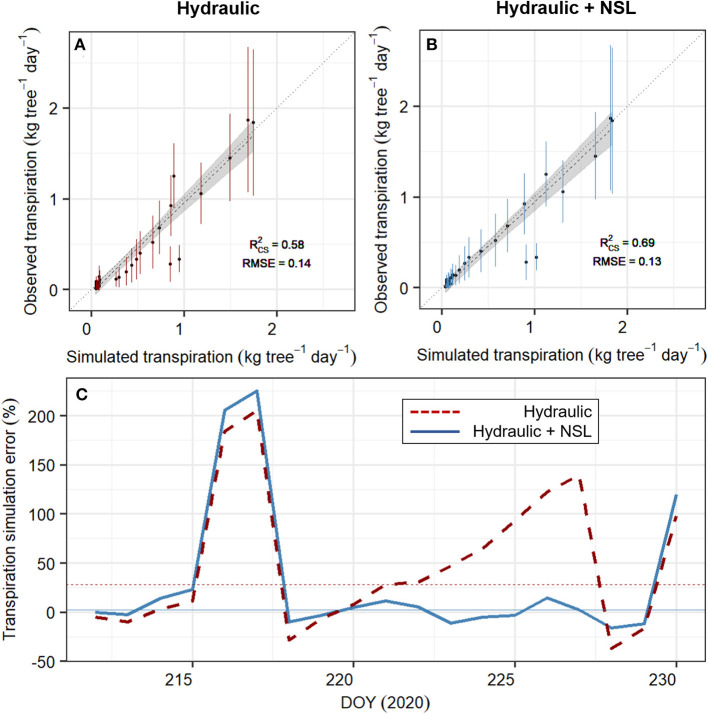
Figure 6.
Performance of the SOX+ model calibrated without (“Hydraulic,” A, in red) and with (“Hydraulic + NSL,” B, in blue) non-stomatal limitations of photosynthesis. (A,B) show the comparison between simulated and observed transpiration (in kg tree−1day−1, points ± SD error bars), during the experiment (DOY 212–265). Daily simulated transpiration is the projected median by sampling 500 times each of the SOX+ model formulation posterior parameter estimates. Noted is the generalized linear model accounting for temporal autocorrelation, model fit (), and the RMSE. In both formulations, the slope was not significantly different than 1 (p < 0.01), and the intercept was not significantly different than 0 (p < 0.01). (C) represents the SOX+ error in transpiration estimates for the calibration period (DOY 212–230), and for the Hydraulic (red, dashed lines) and Hydraulic + NSL (blue, continuous lines) formulations. Simulation error was calculated as , where Trsim is the daily median transpiration from the 500 model, and Trobs is the daily observed transpiration, both in kg tree−1 day−1. Horizontal lines represent the median simulated error for each SOX+ formulation.

