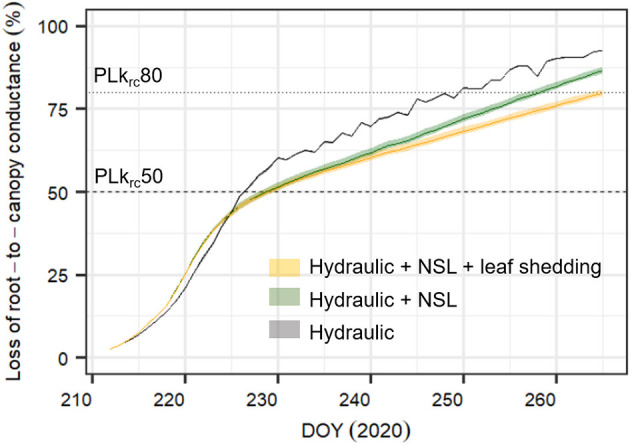
Figure 7.

Simulated percent loss in root-to-canopy conductance during the experiment (PLkrc, in %) with three different SOX+ model formulations. Only hydraulic constraints on stomatal conductance (Hydraulic, in gray); hydraulic constrains on stomatal conductance and non-stomatal limitations of photosynthesis accounting for equal leaf area during the whole experiment (Hydraulic + NSL, in green); and hydraulic constraints on stomatal conductance, non-stomatal limitations of photosynthesis, and observed leaf shedding (Hydraulic + NSL + leaf shedding, in orange). Posterior parameter distributions are different for (Hydraulic) and (Hydraulic + NSL, Hydraulic + NSL + leaf shedding), see Table 2. For each model formulation, the figure shows the daily pre-dawn median ± 95% CI PLkrc, obtained from running the simulation by sampling 500 times the posterior parameter distribution. Horizontal lines indicate when krc = 0.5 * krc,max (PLkrc50, dashed line), and when krc = 0.2 * krc,max (PLkrc80, dotted line), a threshold that has been found to be critical for pine survival probability (Hammond et al., 2019).
