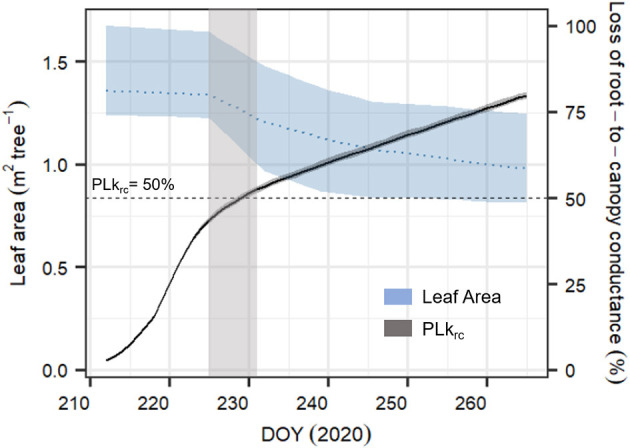
Figure 8.

Time series of averaged leaf area (in m2 tree−1, blue dashed line) for the six monitored Pinus sylvestris saplings and simulated dynamics in percent loss in root-to-canopy conductance (PLkrc, in %, black continuous line) according to the complete SOX+ model scheme (Hydraulic + NSL + leaf shedding). Daily leaf area is represented as the mean ± SD. Daily simulated PLkrc is represented as the median ± 95% CI after 500 model simulation runs by sampling the posterior parameter estimate. The horizontal line indicates when krc = 0.5 * krc, max (PLkrc50, dashed line), while the light gray area represents the uncertainty of when the leaf shedding rate accelerated. Because of weekly sampling campaigns, the area is relatively broad.
